 Valentin V. Mikhailov
Candidate of Physical and Mathematical Sciences, and Advanced Doctor of Historical Sciences, [email protected]
1996 Russian Presidential Election. The Scale of Electoral Fraud
Abstract
Many opinions on the quality of the 1996 Presidential election in Russia are not fully supported by facts. The paper provides an original and more detailed analysis of regional and district administrations potentially intervening in record keeping of their subordinate territorial election commissions (TECs) and precinct election commissions (PECs). Based on the results of the analysis, the author concludes that the scale of electoral fraud in favor of Boris Yeltsin has been significantly exaggerated, and the "aid" that was illegally provided to Gennady Zyuganov in the form of votes, especially in the first round, has been underestimated.
25 Years Later: Time for a Reassessment
The state of Russia's electoral system can hardly be called satisfactory, and it only continues to deteriorate with every new law that is passed. The remarkable efforts of observers cannot counter the work of a powerful administrative chain of command. Asking questions like "How and why did it happen? When did the democratic principles start to deteriorate?" very often brings one to the 1996 Russian presidential election. A popular belief is that 1996 was when things started to go wrong, that electoral fraud helped Boris Yeltsin to snatch the victory out of CPRF candidate Gennady Zyuganov's hands.
Indeed, the 1996 election stand out among all other elections of the post-Soviet era. First, they were highly competitive: these were the only presidential elections in Russia that went to the second round. The first round took place on June 16, while the second did two weeks later, on July 3. In the first round, the incumbent Boris Yeltsin and CPRF leader Gennady Zyuganov were in the lead with a 3% difference: 35.28% and 32.03% respectively. They were followed by Alexander Lebed with 14.52% and Grigory Yavlinsky with 7.34%, and neither of them fit the modern definition of "systemic" opposition. Second, the radical difference in views of the two main presidential candidates greatly increased the cost of victory and defeat for both Yeltsin's democratic supporters and Zyuganov's communist supporters. The third important point was that although by that time, the institution of fair and free elections had already been established and the corresponding laws were adopted, the principles of democratic elections had not yet become something natural and necessary for local administrations. Local administration workers were not dismissed from the actual process of organizing the election, but there was nevertheless too strong a temptation to tweak the results as dictated by their administrative instincts, the desire for political gain and the instructions of their superiors. The numbers of independent observers were insufficient, they were often suspended from work in electoral commissions and their complaints were ignored.
Now, 25 years later, analysts agree that 1) electoral fraud in the first round was committed in favor of both Zyuganov and Yeltsin, 2) in the second round, results in a number of regions indicated a significant shift of Zyuganov's supporters to the incumbent's sidej, and the only reasonable explanation is the use of administrative resources and fraudulent practices.
As for the scale of administrative influence and electoral fraud, the argument is still ongoing. In his latest book, Mikhail Zygar reports that the court found that "about 600 thousand votes were stolen from Zyuganov" in Tatarstan. The communists did not have enough money to go to court in other regions [11: 562]. In 2012, journalist Maxim Shevchenko recalled the words that his senior colleague, Vitaly Tretyakov, spoke shortly after the election, claiming that Zyuganov won "the first round by a sufficient margin" [3].
On the 20th anniversary of the election, Kommersant newspaper recalled the skeptical question: "Could Yeltsin, who was extremely unpopular at the time, honestly beat Zyuganov, whose party just won the State Duma election?" Kommersant also recalled the words of Dmitry Medvedev, who in February 2012 allegedly said, "Yes, the State Duma election weren't exactly sterile, but it's unlikely that anyone has doubts as to who won the 1996 presidential election. It wasn't Boris Yeltsin" [2; 11: 610].
These statements and opinions on Zyuganov's victory cannot be reconciled with the facts at hand. In order to ensure Zyuganov's victory in the first round and gain more than half of the votes, one would have had to add 13 million votes to the existing 24 million. This would have been impossible, since the 22 million votes cast for all the other candidates except Zyuganov and Yeltsin cannot be put to question. We have no evidence of fraud in favor of either Alexander Lebed, who gained 11 million votes, or Grigory Yavlinsky, who gained 5.5 million, or others. In addition, from a statistical point of view, Yeltsin's votes look quite clean in most regions, which cannot be said about Zyuganov's votes. We shall verify this statement below.
Zyuganov's victory in the second round was also impossible. Yeltsin's advantage in the July 3 vote totaled 10 million votes. While there indeed was an obvious transfer of votes in his favor in some republics and regions, there is no evidence that over 2 million votes for Zyuganov went to Yeltsin. Most likely, this level is overstated as well. A similar conclusion has been repeatedly defended before, including by experts like Dmitry Oreshkin [2], Arkadii Lyubarev [3] and Kirill Rodionov [9]. O. Moroz points out that the election result corresponds to the estimates published by Russian Public Opinion Research Center (VTsIOM) and Institute for Comparative Sociological Research with a 2-3% accuracy [7: 396].
The number of fraud assessments is much lower than that of verbal allegations of fraud in the 1996 elections. The author previously put the amount of transferred ballots in the second round at between 700 thousand and one million votes [4: 48; 6: 290].
Despite the lack of evidence and analytical data, we will definitely see new speculations on how "victory was stolen from Zyuganov in 1996", as it fits the myth of the 1990s being the source of all our 21st century troubles all too well. It also allows us to justify current electoral manipulations in the Russian Federation with the false thesis "electoral fraud has always been there".
The paper thus sets the following objectives: 1) to conduct a more detailed assessment of the transfer of ballots in favor of Yeltsin in the second round, 2) to assess the possibility and scale of electoral fraud in favor of the two main candidates in the first and second rounds in different regions, 3) to provide a new assessment of vote transfers in the second round, 4) to compare the quality of the 1996 election with that of the 2000 and 2004 elections.
The study is based on the official results obtained from 2715 territorial election commissions (TECs) that operated in 88 federal subjects of Russia. We did not include 12 TECs in Chechnya, since military operations there were ceased only in August 1996, when the Khasavyurt Accord was signed. The study also pays special attention to results of precinct commissions of three districts of the Republic of Tatarstan.
It should be borne in mind that the set of statistical methods of detecting electoral fraud used in the article is far from complete. Therefore, new studies that look at the issue from a different perspective are most welcome.
Voter Reorientation: Old Method, New Results
In 1996 presidential race took place at a time when democracy was fragile, and when regard for fair elections was not that common. Back then, votes were "tweaked" in both rounds, in favor of both Boris Yeltsin and Gennady Zyuganov. Researchers generally agree that electoral fraud was committed on a limited scale, far from what would transpire in subsequent elections in Russia – they had their own framework, which was quite narrow in many regions.
A two-round election is more difficult to organize and it requires more funding. It is also not easy to maintain turnout and voter motivation at a good level in the second round. However, a two-round election has a number of advantages. In terms of results statistics, there are several additional general restrictions on results that are not present in regular single-round elections. Here are the two main ones:
Property A. With an approximately equal turnout level, the core of voters of the two main contenders remains the same in the short time between rounds, so the result of the second round cannot radically (by several times) change in favor of one of the contenders. There can be a change in the voting proportions, which is natural, but it will be a limited change.
Property B. The result of each of the two main candidates in the second round can only grow, and the only question that remains is by how much. This occurs because voters who supported candidates who did not go to the second round often make their second-round choice without considering the opinions of their first-round candidates. Therefore, even if all the candidates who did not qualify for the second round recommend their voters to vote for one of the remaining candidates, there will be a considerable number of those who will cast the ballot in favor of another candidate. For example, in the 2002 presidential election in France, Jacques Chirac and Jean-Marie Le Pen went to the second round. This event spurred a lot of drama in the media as well as mass demonstrations and rallies of French voters who protested against Le Pen's political views. All of the dropout candidates publicly supported Chirac. Nevertheless, Le Pen retained his share of votes and even managed to increase it slightly [6: 266].
In 1996, there was no reason for violating these rules. However, this could not stop heads of regions and heads of district administrations. Fraud was obvious in a number of cases, and its scale was large for certain republics or regions.
Changing Proportions – Vote Transfers
Where does the natural change in proportions end and the rigged flow (transfer) of ballots begin? For example, in the first round of the 1996 election in Kostroma Oblast, Yeltsin and Zyuganov received 28% each, and in the second, 49% and 42% respectively. Both candidates gained votes, and Yeltsin gained more at the expense of Lebed's and, apparently, Yavlinsky's voters as well, which is normal. In other regions, the changes were more significant, which is also acceptable. However, when one candidate receives fourteen times more votes than his rival in the first round and loses a lot in the second round (Magaramkent TEC in Dagestan), this raises doubts about the viability of democracy or the free and fair election.
The history of the Russian elections shows that the problem specifically lies in the inability to express your will freely while voting. To separate normal and abnormal results, we shall formalize the transfer of votes by introducing \(K\) as voter reorientation coefficient. We shall define the coefficient as the ratio \(K = K_2 / K_1\) , where \(K_1 = E_1 / Z_1\) , \(K_2 = E_2 / Z_2\), \(E_1\) is Yeltsin's percentage result in the 1st round, \(Z_1\) is Zyuganov's result in the 1st round, and \(E_2\) and \(Z_2\), are their respective results in the 2nd round.
On June 16, Boris Yeltsin received 26.66 million votes while Gennady Zyuganov received 24.21 million. The ratio of two numbers is \(K_1 = 1.10\). In the second round, the candidates' respective results equaled 40.20 million and 30.10 million votes. The ratio of these numbers is \(K_2 = 1.34\). From here it follows that the reorientation coefficient for the entire country is \(K = K_2 / K_1 = 1.22\).
By calculating \(K\) for regions, and then for all 2715 TECs, we shall obtain data sets that follow certain patterns and can serve as a basis for analysis. The author discussed \(K\) coefficients in all 2715 TECs in detail before [5; 4: 32–49; 6: 261-291].
The change range of \(K\) for different TECs within one region was one of the indicators of a normal electoral situation. In two thirds of the regions, \(K\) never went over 1.6, and in many of them, it varied within an even narrower range between 0.9 and 1.4. This gave reason to take \(K=1.6\) as the maximum normal deviation. The cited works contain graphs, tables are given, and an account election results in villages and cities, districts and regions (federal subjects). After comparing the reorientation in different TECs, we identified a group consisting of 10 republics, 2 oblasts and 1 krai with a noticeable number of districts that underwent anomalous reorientation.
We have to point out that the \(K=1.6\) value of the maximum normal deviation was found empirically, without using a general theoretical approach. This value shall be given a more substantiated clarification below, which also relies on a specific database of the 1996 election. However, even after this clarification, the \(K=1.6\) value cannot be used as a strict basis for assessing the election quality at one TEC; it should be used to work with the data set for a number of commissions. At the same time, the \(K≤ 1.6\) filter may let administrative pressure skip in some cases (if \(K\) ranges between 1.5 and 1.6, for example), especially in large TECs. For a more accurate assessment, we would have to move to precinct commission level, which is what we shall actually do below for all PECs in three districts of the Republic of Tatarstan.
The \(K\) coefficient in the TEC selection has a special feature: it varies within narrow limits and does not depend on political preferences of voters if no pressure is put on the electoral process. In other words, \(K\) has similar values in both the regions that supported Yeltsin and the regions that voted for Zyuganov. In the 1996 election, this rule was confirmed multiple times. For example in the neighboring Leningrad, Novgorod, Tver and Pskov Oblasts, K ranges between 1.15 and 1.20. However, the first two indicated an advantage of over 1.5 for Yeltsin, the third indicated equal voter support for both Yeltsin and Zyuganov, the fourth indicated Zyuganov winning by a ratio of 30:24. Different TECs also show a stable \(K\) within the same region. For example, in Udmurtia, five districts of Izhevsk indicated that \(K\) was within a narrow range between 0.99 and 1.07 with an almost twofold advantage of Yeltsin over Zyuganov. In Karakulinskaya, Balezinskaya and Kiznerskaya TECs, the \(K\) coefficient was practically the same, amounting to 1.02, 1.06 and 1.12 respectively with a two-fold advantage of Zyuganov over Yeltsin this time. For more examples, see [6: 263-264].
However, the author's previous works did not provide a) a solid rationale for normal range of \(K\) for TECs and b) a clear algorithm for counting the number of transferred votes. It was therefore impossible to make a more detailed assessment of the total scale of deviations from the normal transfer (\(K\) is less than or equal to 1.6) in individual regions and in across Russia in general.
To eliminate this gap, the author followed the well-established pattern described by Sergei Shpilkin [10] to produce a frequency distribution graph for the \(K\) coefficient for all 2715 TECs (see Figures 1 and 2). In addition to the complete graph in Figure 1 there is a graph with an abridged \(K\) range in Figure 2, which clearly shows a slightly asymmetric bell curve with a maximum approximately standing between \(K=1.1\) and \(K=1.2\). As a first step in finding a center, let us assume that this center is \(K=1.15\). To the right of the bell curve, we see a long tail going up to \(K=22.22\) (Bavlinskaya TEC, Republic of Tatarstan). To the left of the bell curve, there is a short tail going up to 0.4 (Erzinskaya TEC, Republic of Tyva). The shape of the bell curve makes it possible to determine all TECs with \(K≥1.6\) as strongly deviating from the norm. This confirms the validity of this earlier established threshold [4: 37; 6: 268].
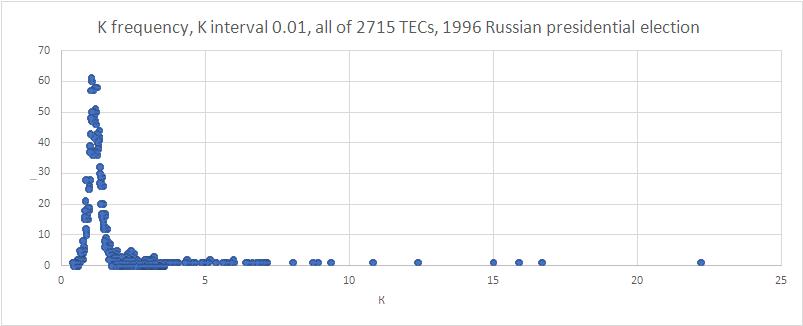
Fig. 1. The frequency distribution of the K coefficient for all TECs of the country.
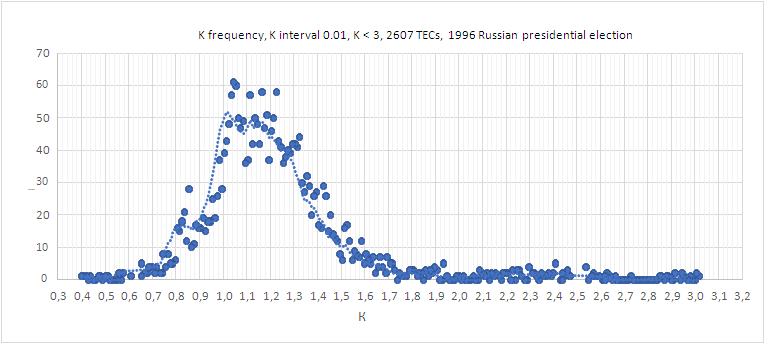
Fig. 2. The frequency distribution of the K coefficient for TECs with a K value less than 3.
To determine the magnitude of the deviation from the norm in a certain TEC, we shall introduce the transfer in \(x\) percentage, replace \(E_2\) with \((E_2-x)=E_3\) and \(Z_2\) with \((Z_2+x)=Z_3\) and draw up a simple equation that brings the vote in the second round to \(K_0=1.15\) (the assumed center of the bell)
\(K_0=K_3/K_1 = Е_3/(Z_3*K_1) = (E_2-x)/((Z_2+x)*K_1) = 1.15 \).
Therefore
\(x = (E_2- K_0*E_1*Z_2/Z_1)/(1+ K_0*E_1/Z_1)\), \(K_0 = 1.15\).
Substituting \(E_3 = (E_2-x)\) и \(Z_3 = (Z_2+x)\) into the ration \(K=K_3/K_1\) we shall get \(K=1.15\). The relative share of adjusting \(x\) makes it possible to find the number of votes of the deviation \(F=x*N_2/100\). The F value for TECs with large \(K\) coefficients of over 1.6 shall be defined as an abnormal transfer of voters most likely spurred by rigging reports or by other illegal methods.
In the Excel spreadsheet, the relative \(x\) deviation and the \(F\) voter transfer are calculated for each of the 2715 TECs. \(K_0\) was chosen as the center of the bell curve, since this value minimizes the total amount of deviations for the symmetrical part of the bell curve without tails. The choice of \(K_0\) determines the accuracy of estimates of vote transfer significantly, but not critically. Recalculating the model with \(K_0=1.2\) and \(K_0=1.14\) made it clear that \(K_0=1.15\) is the best option.
The results are summarized in Table 1. It can be seen that the volume of vote overflow (transfer) for 277 TECs with \(K≥1.6\) amounts to 16% of the number of participants, while for the central part it amounts to only 0.09%.
Table 1. Vote overflow in TEC with a different level of the K coefficient
| К (max) | К (min) | N TEC | F sum | 2nd round participation | F% |
| 22.22 | 1.6 | 277 | 948685 | 5929494 | 16.00 |
| 1.59 | 0.7 | 2410 | 62788 | 68062044 | 0.09 |
| 0.69 | 0.4 | 28 | -48541 | 460062 | -10.55 |
| 2715 | 962932 | 74451600 |
К0=1.15
The abnormal overflow in all 277 TECs amounts to 950 thousand (948,685) votes. This is an assessment of administrative intervention in the first and second rounds provided only by this model, which does not include other types of electoral fraud. For example, if there was any administrative "tweaking" of votes in favor of one candidate in both rounds, our method will not be able to identify it. There is also a small number of TECs where \(K\) is within normal range, but Property B has not been executed, and in the second round Zyuganov lost part of the votes he received in the first round.
There are 231 TECs in 13 "suspicious" regions that accumulated 885 thousand (884,514) overflow votes, meaning 93.5% of total overflow (see Table 2). In these regions, the share of overflow varies from 1.1% in Adygea, to 17% each in Ingushetia, Karachay-Cherkessia, North Ossetia and 20% in Dagestan. The largest absolute contribution to vote overflow is divided between Tatarstan (255 thousand), Dagestan (182 thousand) and Bashkortostan (111 thousand), which amounts to 62% of the sum of all thirteen regions from the table.
Table 2. Vote overflow in "suspicious" regions
| Region | voters in 2nd round | К of region | TEC Total number | N ТИК (K≥1,6) | Voter transfer | Transfer % | |
| 1 | Republic of Adygea | 220821 | 1.47 | 8 | 2 | 2514 | 1.14 |
| 2 | Republic of Bashkortostan | 2294983 | 1.20 | 75 | 32 | 110797 | 4.83 |
| 3 | Republic of Dagestan | 879631 | 2.65 | 53 | 42 | 182300 | 20.72 |
| 4 | Republic of Ingushetia | 94950 | 2.72 | 6 | 4 | 16256 | 17.12 |
| 5 | Kabardino-Balkarian Republic | 407685 | 1.84 | 11 | 5 | 21042 | 5.16 |
| 6 | Republic of Kalmykia | 147311 | 1.16 | 14 | 5 | 5126 | 3.48 |
| 7 | Karachay-Cherkess Republic | 219958 | 2.32 | 10 | 8 | 37303 | 16.96 |
| 8 | Republic of Mordovia | 522503 | 1.96 | 27 | 25 | 61877 | 11.84 |
| 9 | Saratov Oblast | 1508191 | 1.29 | 48 | 10 | 19755 | 1.31 |
| 10 | Republic of North Ossetia | 311064 | 2.63 | 10 | 10 | 54136 | 17.40 |
| 11 | Stavropol Krai | 1340538 | 1.52 | 33 | 18 | 49783 | 3.71 |
| 12 | Rostov Oblast | 2406762 | 1.38 | 62 | 22 | 67764 | 2.82 |
| 13 | Republic of Tatarstan | 2039226 | 1.89 | 60 | 48 | 255861 | 12.55 |
| Total | 12393623 | 417 | 231 | 884514 |
The remaining 6.5% of the overflow is distributed among 46 TECs in seventeen regions. In each of them, the share of deviations over \(K=1.6\) amounts to a fraction of a percent of those who voted in the second round.
The Structure of Vote Overflow. PEC Reports
To assess the electoral fraud, it is important to understand that the 950,000 votes that make up the size of the abnormal voter reorientation contain cases of electoral fraud in favor of both Yeltsin and Zyuganov. This conclusion can be drawn from Table 3, which presents data from sixteen PECs of three districts of the Republic of Tatarstan. These three districts are leading the transfer list across Tatarstan as well as Russia: Bavlinskaya TEC \(K=22.22\); Zainskaya TEC \(K=15.01\); Muslyumovskaya TEC \(K=8.73\). On Russia TEC list, they placed 1st, 5th and 9th respectively. Certain precinct commissions indicated that Yeltsin received only a handful of ballots in the first round, trailing behind Zyuganov by tenfolds, while in the second round the situation was the exact opposite. This seems implausible even in the context of the PECs where voter opinions changed radically. Such transformational changes mean that the will of the voters was ignored, and that district authorities made every effort to produce results to please their customer in the Kazan Kremlin. The events that transpired in the most government-friendly districts of Tatarstan represent the most telling part of all vote manipulations carried out in the republic.
Table 3. Voter transfer in 16 PECs in three districts in Tatarstan
| TEC | PEC No. | No. of voters | turnout % | E1 | Z1 | E2 | Z2 | К | |
| 1 | Bavlinskaya | 427 | 250 | 100.0 | 67 | 143 | 245 | 5 | 104.6 |
| 2 | Bavlinskaya | 437 | 782 | 100.0 | 180 | 500 | 772 | 16 | 134.0 |
| 3 | Bavlinskaya | 438 | 497 | 100.0 | 21 | 442 | 457 | 16 | 601.2 |
| 4 | Bavlinskaya | 440 | 400 | 100.0 | 24 | 357 | 362 | 29 | 185.7 |
| 5 | Bavlinskaya | 441 | 174 | 99.4 | 1 | 150 | 163 | 14 | 1746.4 |
| 6 | Bavlinskaya | 445 | 396 | 100.0 | 73 | 225 | 378 | 10 | 116.5 |
| 7 | Zainskaya | 1684 | 279 | 100.0 | 6 | 253 | 226 | 52 | 183.3 |
| 8 | Zainskaya | 1685 | 211 | 100.0 | 0 | 205 | 166 | 40 | ∞ |
| 9 | Zainskaya | 1687 | 197 | 100.0 | 5 | 188 | 180 | 17 | 398.1 |
| 10 | Zainskaya | 1704 | 239 | 86.6 | 15 | 142 | 170 | 23 | 70.0 |
| 11 | Zainskaya | 1712 | 121 | 90.1 | 4 | 99 | 87 | 27 | 79.8 |
| 12 | Muslyumovskaya | 457 | 167 | 100.0 | 19 | 121 | 156 | 5 | 198.7 |
| 13 | Muslyumovskaya | 458 | 160 | 98.8 | 12 | 139 | 124 | 30 | 47.9 |
| 14 | Muslyumovskaya | 463 | 111 | 100.0 | 1 | 94 | 103 | 5 | 1936.4 |
| 15 | Muslyumovskaya | 470 | 261 | 100.0 | 22 | 228 | 192 | 37 | 53.8 |
| 16 | Muslyumovskaya | 474 | 297 | 98.3 | 19 | 242 | 283 | 7 | 514.9 |
| Total | 4542 | 98.9 | 469 | 3528 | 4064 | 333 | 91.8 |
Bavlinskaya TEC К=22.22; Zainskaya TEC К=15.01; Muslyumovskaya TEC К=8.73. 1, 5 and 9 places on the list of all TECs of RF.
It is worth noting that such 180-degree turns occurred in small PECs, where the number of voters stood between 300 and 400. Larger settlements in these three districts indicate nothing of the sort, although it is natural that we do not find any normal reorientation in any PEC there. In other areas with general abnormal values, there is no doubt that the results of individual PECs will reveal telltale signs of electoral fraud.
The examples in Table 3 indicate that electoral fraud was committed in favor of Zyuganov in the first round. It may therefore be argued that there is no rational and psychological explanation for why voters in a Bavlinsky District village (PEC 441) gave 150 votes to Zyuganov and only one vote to Yeltsin in the first round, but 14 votes to Zyuganov and 163 to Yeltsin in the second. The division into large and small villages within the Bavlinsky and Muslyumovsky Districts confirms that smaller settlements are under greater pressure (Table 4). The authorities achieve their goals more easily where people are less protected from their actions [6: 358-359]. Interestingly enough, the division only manifests in the first round. In the second round, when Kazan had to justify itself for weak support of Yeltsin in the first round, the division goes away: all villages indicate high results for Yeltsin and low results for Zyuganov.
Table 4. Division based on the size of city/town/locality
| No. of voters | Yeltsin% | Zyuganov% | |
| Bavlinskaya TEC | |||
| 1st round | over 400 | 32.4 | 42.7 |
| 1st round | below 400 | 25.1 | 56.9 |
| 2nd round | over 400 | 89.2 | 5.7 |
| 2nd round | below 400 | 89.7 | 6.4 |
| Muslyumovskaya TEC | |||
| 1st round | over 400 | 20.1 | 64.7 |
| 1st round | below 400 | 15.3 | 72.5 |
| 2nd round | over 400 | 60.8 | 30.6 |
| 2nd round | below 400 | 63.3 | 29.0 |
The electoral situation in other districts of the republic is not much better. In the early 1990s, district administrations in Tatarstan developed a strong sense of subordination to the authorities in Kazan. Back then, there formed a nucleus of districts that showed abnormal results in one election after the other. This nucleus includes all 43 rural districts. The author has already provided a turnout graph for nine districts in 14 different elections in 1991–2003: Aktanyshsky, Apastovsky, Atninsky, Baltasinsky, Drozhzhanovsky, Kaibitsky, Muslyumovsky, Cheremshansky and Tyulyachinsky districts unfailingly indicated turnout of over 98, and even as much as 99% [6: 196]. It is obvious that the results in these districts fully satisfy the demands of Kazan authorities. In 1996, all nine districts showed a high \(K\) coefficient between 3.23 and 8.73.
These anomalies spread to other districts as well. The uncontested presidential elections in the Republic of Tatarstan in March 1996 are a good example. Official data indicated that 34 out of 43 rural districts gave incumbent Mintimer Shaimiyev 90% of the votes from the electoral roll (!). In Kazan, he received 71%, and in other cities, including Naberezhnye Chelny – 63%. In authoritarian Tatarstan, rural areas are an extremely disciplined electoral group. This group may often include most of the republic's ten cities.
Therefore, it is not surprising that in 1996, the total \(K\) coefficient of all 43 rural districts of Tatarstan turned out to be very high, amounting to 3.5: judging by the official data, 400 thousand voters who voted for Zyuganov in the first round turned into two hundred and forty thousand in the second, and Yeltsin's 270 thousand supporters more than doubled their number. In fact, it was this massive transformation of the villagers of Tatarstan from pronounced opponents into great admirers of Yeltsin that allowed Tatarstan to be ranked among the "monolithic reformist regions", as was noted in the analytical reviews on the results of that election. Tatarstan's reputation as a monolithic reformist region came as a result of attempts to secure oneself in case of Zyuganov's possible win by committing electoral fraud in his favor, and then, in the second round, with the help of new manipulations in favor of Yeltsin.
Retreat: Kazan, Round One
Between these main events, when the first-round results were being processed, the Kazan "incident" took place, which has officially become the largest electoral fraud case concerning vote returns in Russia so far [6: 278-282]. The headquarters of the Equality and Legality (Ravnopraviye i zakonnost) democratic bloc and CPRF had all seven primary district reports from Kazan TECs at their disposal. The results in these reports were noticeably different from the results in the final table and the results in the reports that were resent to the Central Election Commission (CEC) of the Russian Federation more than a day later. The vote increase for Yeltsin in Kazan amounted to 47,040 votes. These are the results broken down by individual TECs: 4,500 votes (Aviastroitelnaya), 7,000 (Vakhitovskaya), 6,100 (Kirovskaya), 6,940 (Moskovskaya), 8,000 (Novo-Savinovskaya), 4500 (Privolzhskaya), 10,000 (Sovetskaya). What stands out is the abundance of zeros, which may be a sign that the order came from either the top brass, or someone "below" took an obligation and diligently fulfilled it. All other candidates became vote "donors": Vladimir Bryntsalov with 96, Yuri Vlasov with 211, Mikhail Gorbachev with 1,157, Vladimir Zhirinovsky with 2,850, Gennady Zyuganov with 13,804, Alexander Lebed with 12,768, Svyatoslav Fyodorov with 1,910, Martin Shakkum with 506, Grigory Yavlinsky with 10,338; 3,400 votes came from "Against all" vote as well. "Against all" lost the largest percentage of all – 39%.
What was the purpose of such blatant rigging? Votes were tallied quite quickly all over Russia on the night of June 16 to 17. All TECs had to submit the results to the CEC within a certain period. At some point, when many territorial commissions had already sent their data, it became clear that Zyuganov was losing in Russia, but winning in Tatarstan. The republic's administration intercepted reports from seven Kazan TECs and rewrote them within 24 hours. Before the rewrite, Zyuganov (38.81%) was ahead of Yeltsin (35.92%) by about three percent in Tatarstan, and after the reports were rewritten, he lost a quarter of a percent. This quarter of a percent can still be seen in official handbooks and on the website of the CEC of Russia. Journalists played out the successful illegal attempt of the Kazan authorities to join the winner's ranks as an example of electoral fraud in favor of the incumbent, but, as we can see, the republican administration actually did Yeltsin himself a disservice: there was a lot of talking, but non much profit.
Vadim Solovyov, who represented CPRF's observers, filed complaint citing the difference between original and final reports. The complaint was handled by the Supreme Court of the Russian Federation on 10 July 1996, at a meeting chaired by Aleksandr Fedin, who sent the case materials to the Office of the Prosecutor General of the Russian Federation, instructing it to check the facts discovered during the trial and decide on opening a criminal investigation. The prosecutor's office was clearly not in a hurry to check, and after a few years the topic disappeared from the public eye and, apparently, from the prosecutor's office itself.
As a result, based on the official results, Kazan stands out in the list of 100 largest cities in Russia with its minimum \(K\) coefficient of 0.72. This is 0.11 less than that of its nearest neighbor, which is an obvious anomaly. If we recalculate results in Kazan with \(K=0.95\), which is more natural for cities of this size, we get that 43,450 votes were added to Yeltsin's result, which amounts to 8.8% of the number of voters who came to the polls. This is very close to the difference between the data of the primary and secondary protocols of 47,040 votes [6: 280].
Kazan's case of electoral fraud was given to illustrate that the Tatarstan authorities were not overburdened with such problems as fair elections and the need to reflect the actual will of the voters in the reports. When it came to political necessity, any necessary conditions of a democratic state and its own constitution, republican and federal, were pushed to the background. This also includes all the peculiarities of elections in rural areas of the republic, and the huge advantage Zyuganov gained there in the first round. Tatarstan was not an isolated case.
Rural Districts of Russia.
The assumption that precinct election commissions (PECs) in rural districts tweaked the vote in Zyuganov's favor in the first round was confirmed by his results in problematic districts – the districts with a high overflow coefficient (\(K\)) in particular. Transitioning to the main level of electoral statistics (the results of precinct commissions) makes it possible to reveal new features of the election results management. Aside from the Republic of Tatarstan, there are 200 TECs that indicate abnormal overflow all across Russia. There, precinct commissions’ records are yet to be processed.
Another method of identifying TECs with abnormal results is to use Property B (see above): the percentage of any candidate does not decrease in the second round. A total of 214 TECs were identified (8% of the overall number), where Zyuganov's second round result was lower. In 144 TECs out of 214, the difference exceeds 10%, and in 56 TECs it even goes over 20%. The vast majority of these commissions were already part of the TECs with an abnormal transformation, but there are new candidates as well. For example, Zyuganov lost 9.4% in Lakskaya TEC in Dagestan (\(K=1.51\)), and 4.4% in Baksanskaya TEC in Kabardino-Balkaria (\(K=1.34\)). Any of these territorial commissions can become a source of new information on electoral results manipulation if we study precinct commission reports.
Let us assess the scale of possible electoral fraud in Tatarstan in favor of Zyuganov in the first round. Let us assume that in reality, Yeltsin and Zyuganov received an equal amount of votes in those 44 TECs of the republic, where Zyuganov formally won. We shall do this while considering the following factors: 1) that Yeltsin beat Zyuganov in the first round in Kazan with a ratio of 51:20; 2) that he also won in 9 rural districts out of 43 in the second round; 3) that in the Oktyabrskaya TEC – the only rural territorial commission with no signs of vote transfer – Yeltsin won a convincing victory in the first round; 4) that Zyuganov eventual win by 1.5 times in rural settlements was brought about by the highly heterogeneous results in TECs in rural areas and small towns. Therefore, it is necessary to deduct 114 thousand (113,621) votes from Zyuganov's result in these TECs.
Considering this assessment, we can conclude that the total overflow of votes in Tatarstan, which is estimated at 256 thousand in Table 2, consists of 114 thousand abnormal votes (44.4%) for Zyuganov in the first round and 142 thousand votes (55.5 %) for Yeltsin in the second round. If we extrapolate this result to all 13 regions with an abnormal K, in which 885 thousand votes of abnormal overflow were identified, then we get that 491 thousand votes were transferred in favor of Yeltsin, and the remaining 394 thousand can be considered a distortion of the first round results created by administrative tweaking in favor of Zuganov.
As far as the author is aware, the overflow of 700–1000 thousand votes has been until now considered as the overall amount of "tweaking" in favor of Yeltsin in accordance with the \(K\) overflow coefficient model.
We cannot say that the post-second round vote transfer in favor of Yeltsin went unnoticed by the CEC of Russia. In 1996 and 1997, the CEC accepted five rulings on violations of this kind in the following TECs: Atyashevskaya (Mordovia), Kazbekovskaya (Dagestan), Volskaya Gorodskaya (Saratov Oblast), Grachevskaya (Stavropol Krai), Azovskaya (Rostov Oblast) and Zelenchukskaya (Karachay-Cherkessia). The total number of fixed violations amounted to 20 thousand votes, which is insignificant against the background of overflow estimates. The assessment here is that the CEC caught a few sparrows in a herd of elephants, whom it naively missed.
Regions for Zyuganov and Regions for Yeltsin. First Round
The previous section demonstrated that 44% of vote overflow in Tatarstan has been contributed by electoral manipulations in favor of Zyuganov in the first round. Is there any reason to believe that the communist leader received rigged "support" in other regions that are not among the 13 special regions in Table 2? What else can we do to substantiate the assumption that 394 thousand votes is the total amount of administrative tweaks of the first round results in favor of Zyuganov, except extrapolating the results of Tatarstan? Let us consider the "turnout–support vote" scatter plots for individual regions, which show the results of both candidates at the same time.
The scatter plot for Voronezh Oblast, where Zyuganov won in both rounds, indicates a significant positive slope of the trend line for Zyuganov, which even increased in the second round (see Figure 3). This means that the vote for Zyuganov is higher in the TECs where turnout is higher, which is a sign of the voting being under administrative control, in Zyuganov's favor in this case.
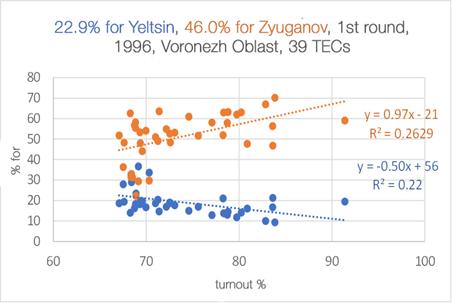
Fig. 3. Voting for Yeltsin and Zyuganov depending on the turnout in the Voronezh Oblast: a) first round;
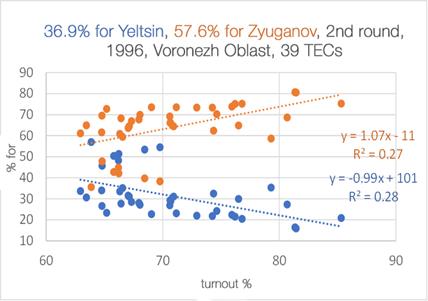
b) second round.
The well-known difference between rural and urban voting contributes to this phenomenon. There is a debate on why election results in rural areas correspond to the interests of the regional authorities more often: is this a manifestation of respect for the appointed person, or does it indicate a greater level of manipulation in the countryside than in the city? We believe that the first assumption is controversial. However, one way or another, the scatter plot for rural TECs in Voronezh Oblast once again indicates a positive slope of the regression line for Zyuganov and a negative one for Yeltsin, although the slope has decreased in both cases. In a homogeneous environment, such a slope substantiates the evidence of manipulations in favor of Zyuganov even further.
Scatter plots for many other regions are qualitatively similar to Voronezh: positive slope for Zyuganov, negative for Yeltsin. The difference is in the size of the tilt angle. These regions include Belgorod Oblast, Bryansk Oblast, Kemerovo Oblast, Oryol Oblast, Pskov Oblast, Rostov Oblast, Saratov Oblast, Tambov Oblast, Altai Krai, Krasnoyarsk Krai, Stavropol Krai, Republic of Buryatia, and others. In Penza, Ulyanovsk and Kursk Oblasts, the dependence is even stronger: the respective slopes of the regression line for Zyuganov are 1.32, 1.50, and 1.68. This group even includes Arkhangelsk, Perm and Yaroslavl Oblasts, where Yeltsin won the first round with a sizeable advantage.
Vologda and Sverdlovsk Oblasts (see Figures 4 and 5) are evidential examples that in a free election, it is natural for voting not to depend on turnout. In this case, scatter plots are different: regression lines are horizontal or close to those in both rounds. It is a common fact that Yeltsin had the strongest support In Sverdlovsk Oblast, where he beat Zyuganov by the largest margin: 48% in the first round. However, there is no positive correlation between votes and turnout.
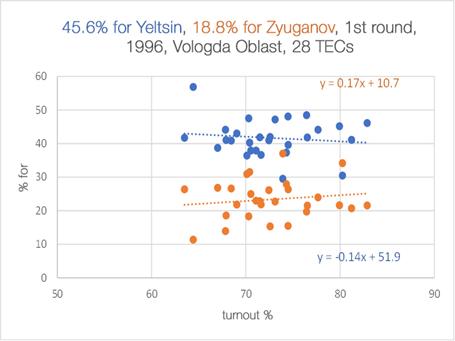
Fig. 4. Voting for Yeltsin and Zyuganov depending on the turnout in the Vologda Oblast: a) first round;
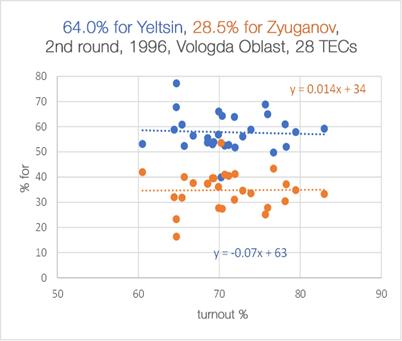
b) second round.
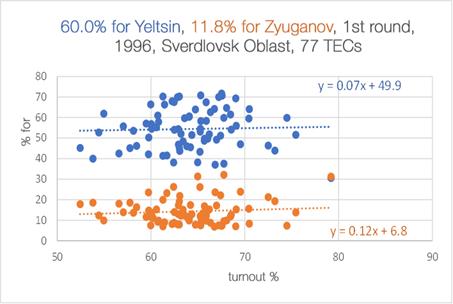
Fig. 5. Voting for Yeltsin and Zyuganov depending on the turnout in the Sverdlovsk Oblast: a) first round;
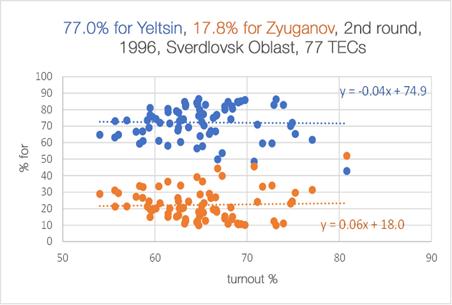
b) second round.
Both oblasts demonstrate how effective Property B is: even in an unfavorable electoral environment, Zyuganov increased his votes in the second round compared to the first: by an average of 8% in each TEC in Sverdlovsk Oblast and by 11% in Vologda Oblast. The scatter plot for rural areas of Sverdlovsk Oblast is not that different from the scatter plot that includes all TECs. This shows that the generally accepted statement of how "electoral preferences of village residents and city residents are very different" that managers of electoral results like to refer to is not universal. It inexplicably manifests itself only in the regions governed by said managers.
Moscow, Saint Petersburg, Moscow Oblast – the largest federal subjects – also did not indicate any visible deviations either.
So, a brief overview of the connection between turnout and voting in a large number of regions shows that in most, if not all regions, there are no signs of rigging in favor of Yeltsin. However, many of them have signs of vote manipulation in Zyuganov's favor. Therefore, the sum total for the entire country should indicate that it was the CPRF leader who benefited from those who managed the results illegally. Moreover, such "management" was noticeably stronger in the first round, which can be easily explained from a political standpoint.
1996, 2000 and 2004 Election. What is the Difference?
Politicians and the media constantly refer to the 1990s as at the time when everything was permitted and violations were numerous, and the 1996 election is referred to as rigged to no end and as the source of modern administrative management of electoral process and results. Let us see what the official nationwide results say about this. The nationwide situation is documented in a single graph.
Figures 6–9 show "turnout-support vote" scatter plots for the 1996 presidential election, while Figures 10 and 11 show scatter plots for the 2000 and 2004 presidential elections. One point corresponds to one of the TECs; each diagram contains more than 2,700 points in accordance with the number of territorial commissions in the corresponding year.
It is known that such diagrams should be treated with some caution [Buzin 2019], but here the estimates are of a strictly qualitative nature. We only try to determine in whose favor the manipulations are being conducted, to compare the relative sizes of the intervention, and therefore do not risk coming to erroneous conclusions.
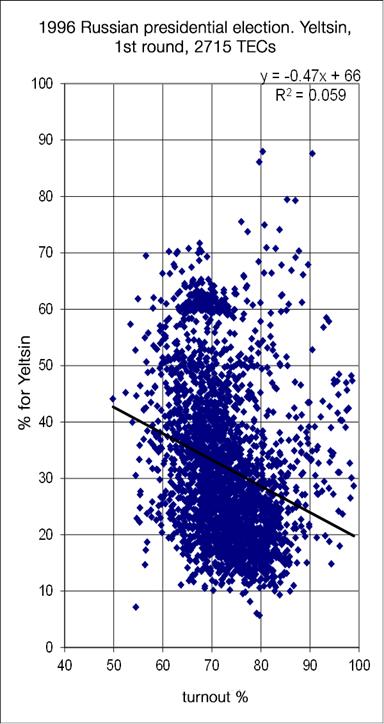
Fig. 6. Voting for Yeltsin depending on the turnout in the first round for all TECs of the Russian Federation.
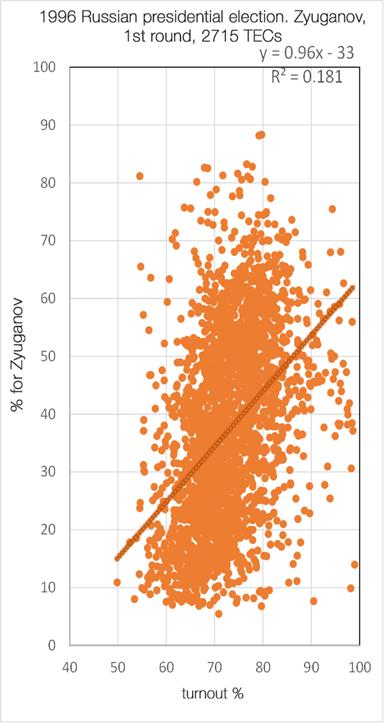
Fig. 7. Voting for Zyuganov depending on the turnout in the first round for all TECs of the Russian Federation.
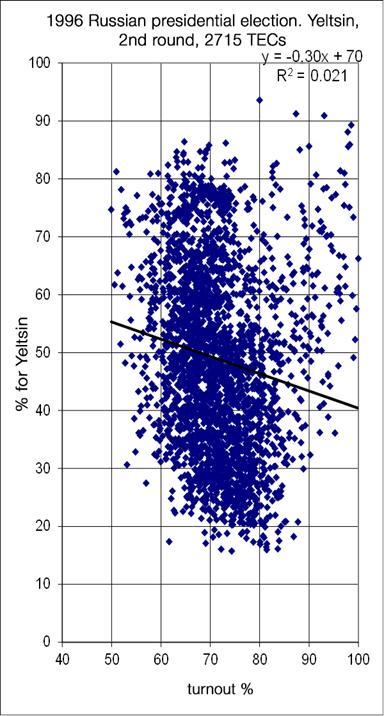
Fig. 8. Voting for Yeltsin depending on the turnout in the second round for all TECs of the Russian Federation.
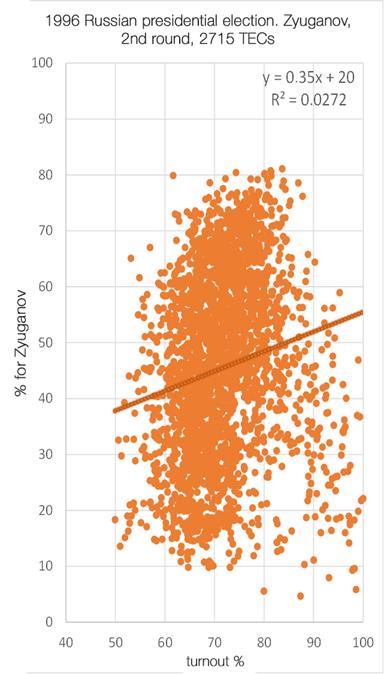
Fig. 9. Voting for Zyuganov depending on the turnout in the second round for all TECs of the Russian Federation.
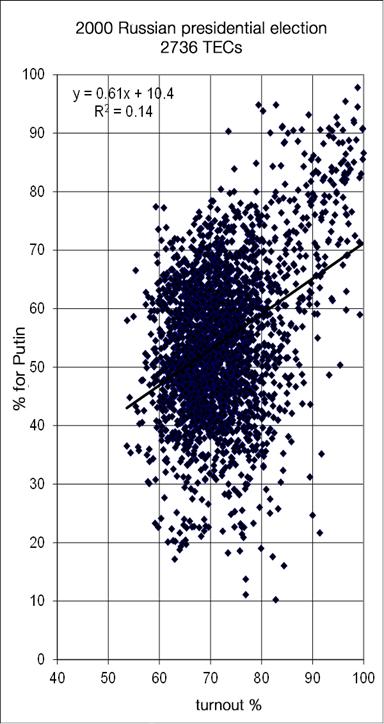
Fig. 10. Voting for Putin depending on the turnout in 2000 for all TECs of the Russian Federation.

Fig. 11. Voting for Putin depending on the turnout in 2004 for all TECs of the Russian Federation.
On Yeltsin's charts, we observe a negative slope of the regression line; in the second round, the slope becomes smaller. Zyuganov's regression lines have a positive slope; the slope is smaller in the second round than in the first. The graphs for the first round confirm the conclusion that the votes in the first round were most likely illigally attributed not to Yeltsin, but to Zyuganov. The same conclusion was made in the previous section when we considered individual diagrams for regions, and here we see confirmation that over half of the regions "helped" Zyuganov. On the contrary, many of Yeltsin's graphs have a negative slope and a large scatter around the regression line, which does not substantiate the conclusion that the results were rigged in his favor.
In this regard, diagrams of votes for Putin in the 2000 and 2004 elections (see Figures 10 and 11) have some similarities with the diagrams of votes for Zyuganov: they have a clear positive slope and a denser concentration of points around the regression line.
Different authors considered the growing statistical anomalies in the Russian elections in 2000 and in subsequent years (see, for example, a series of works by Mikhail Myagkov's group and works by Sergei Shpilkin [8; 10]. Over the past two decades, significant anomalies have gone beyond the boundaries of certain republics and can be observed in other regions of the country. If we look for the roots of this phenomenon in the 1996 elections, then they can be found rather in the administrative zeal of regional top brass to support Zyuganov than in centralized manipulations in favor of Yeltsin, which we did not find.
Conclusion
Several regions in the 1996 elections, especially republics, indicated diverse manipulation of results: in Zyuganov's favor in the first round and in Yeltsin's in the second. Their scale makes it very difficult (if there is such a chance) to reveal the true expression of the will of voters in these regions. For example, it is unclear what the results of both candidates in Dagestan and Tatarstan would have been if there had not been any vote manipulation.
Vote transfer from Zyuganov to Yeltsin in the second round was identified quickly, and the media focused their opinions on him. However, the question that remained on the sidelines was how Zyuganov could have won a major first round victory in several republics specifically in rural areas, which are tightly controlled from the regional capital. Zyuganov's easy victory in many areas was also left without due critical discussion.
This paper, in addition to the author's previous paper, uses three methods of detecting fraud: 1) assessing vote transfer in each TEC individually, 2) reviewing the official results of the PECs that were not considered earlier, and 3) building "turnout-support vote" diagrams for TECs in many regions.
To assess the vote transfer, we drew a bell-shaped frequency curve of \(K\) overflow coefficient, and obtained confirmation of the author's previous estimates on the regular threshold of the \(K=1.6\) coefficient. The paper also clarified the sum of vote transfers from Zyuganov to Yeltsin in all TECs that had \(K\) value deviations. It amounted to 950 thousand votes, where 885 thousand votes fell to regions that indicated anomalies.
Using methods 2 and 3, we determined that in the first round, the results were distorted in Zyuganov's favor by 394 thousand votes. After that, it became clear that the anomalous overflow in favor of Yeltsin brought him 491,000 votes (=885–394).
Almost all (94%) of overflow occurred in 13 regions that were previously known. The contribution of Tatarstan, Dagestan and Bashkortostan is over three-fifths of the total overflow.
We discovered that the largest regions – Moscow, Saint Petersburg, Sverdlovsk, Moscow Oblast and some others, such as Vologda and Irkutsk Oblasts – indicated no correlation between voting and turnout, which is what should happen when there is no deliberate interference in the results.
This paper does not answer all the questions about the 1996 Russian presidential elections. There are a number of methods that have already been well tested for elections in recent years. For example, the frequency dependence of turnout, proportion of invalid ballots and voting "against all" in different commissions, an abnormally narrow range of changes in certain electoral indicators. With their help, it will be possible to clarify other aspects of this important event for the new Russia.
Once again, we have to point out that all the numerical estimates of the electoral fraud in this work should be treated with caution, and one has to understand that they reflect the features of the used models and require additional confirmation by other methods or from other sources, for example, from witnesses.
The full official results of the past elections are a rich source for electoral statisticians to identify violations in the processes of counting votes and summarizing results. The rigging and manipulation of the results contained in these databases are like artifacts of the past encased in amber. There is still much fresh ground to cover for researchers, and they can begin a search any time.
Received 29.04.2021, revision received 11.05.2021.
References
- Buzin A.Yu. The Modification of Sobyanin-Soukhovolsky Method. – Electoral Politics. 2019. No. 1. - http://electoralpolitics.org/en/articles/modifikatsiia-metoda-sobianina-sukhovolskogo/
- Korchenkova N. Golosovali, a to proigrali by [We Voted Not to Lose]. – Kommersant, No. 106, 17 June 2016. P. 8. URL: https://www.kommersant.ru/doc/3013608 (accessed 12.05.2021). (In Russ.) - https://www.kommersant.ru/doc/3013608
- Lyubarev A.E. Zyuganov otvergayet mif o svoyei "pobede" v 1996 godu [Zyuganov Denies the Myth of His 1996 Win]. – Echo of Moscow radio station website, 8 January 2013. URL: https://echo.msk.ru/blog/lyubarev/985460-echo/ (accessed 10.04.2021). (In Russ.) - https://echo.msk.ru/blog/lyubarev/985460-echo/
- Mikhailov V. Demokratizatsiya Rossii: razlichnaya skorost v regionakh (Analiz vyborov 1996 i 2000 gg. Mesto Tatarstana sredi subyektov RF) [Democratization of Russia: Varying Speed in the Regions (Analyzing Elections of 1996 and 2000. Tatarstan's Place Among Other Federal Subjects of Russia)]. – Osobaya zona: vybory v Tatarstane. Ulyanovsk: KOMPA, 2000. P. 25–84. (In Russ.) - http://www.democracy.ru/library/articles/tatarstan/page3.html
- Mikhailov V.V. Kolichestvo demokratii (Analiz vyborov Prezidenta RF 1996 g. v regionakh) [The Amount of Democracy (Analyzing the 1996 Russian Presidential Election in Regions)]. – Armageddon. 1999. No. 3. P. 134–153. (In Russ.)
- Mikhailov V.V. Respublika Tatarstan: Demokratiya ili suverenitet? [The Republic of Tatarstan: Democracy or Sovereignty?]. Moscow, 2004. 466 p. (In Russ.)
- Moroz O. Vybory 96: krasnym skazali "STOP!" [The 1996 Election: Saying "STOP!" in Red]. Moscow: Politicheskaya entsiklopediya, 2016. 423 p. (In Russ.)
- Myagkov M., Ordeshuk P.K., Shakin D. Falsifikatsii ili domysly: opyt vyborov v Rossii i v Ukraine [Electoral Fraud or Speculation: Elections in Russia and Ukraine]. – Sotsiologiya: teoriya, metody, marketing. 2005. No. 2. P. 116–155. (In Russ.)
- Rodionov K. Byli li chistymi presidentskie vybory 1996? [Were the presidential elections 1996 clean?]. – The project “Gaidar – Russian liberalism” website, 30.07.2015. URL: https://gaidar.center/articles/transparent-election-1996.htm/ (assessed 25.04.2021) (In Russ.) - https://gaidar.center/articles/transparent-election-1996.htm/
- Shpilkin S. Matematika vyborov-2011 [Mathematics of the 2011 Elections]. Troitsky variant. 2011. No. 94. 20 December 2011. P. 2-4. URL: https://trv-science.ru/2011/12/matematika-vyborov-2011/ (accessed 25.04.2021). (In Russ.) - https://trv-science.ru/2011/12/matematika-vyborov-2011/
- Zygar M. Vse svobodny. Istoriya o tom, kak v 1996 godu v Rossii zakonchilis vybory [We are All Free. The Story of How the 1996 Russian Election Came to an End]. Moscow: Alpina Publisher, 2021. 637 p. (In Russ.)