 Arkadii E. Lyubarev
Candidate of Biological Sciences and Candidate of Legal Sciences, [email protected]
Municipal Elections in Russia through a Lens of Electoral Statistics
Abstract
The paper dwells on the specifics of local government and municipal elections and how the latter is different from the elections of state authorities. We analyze electoral statistics for three election cycles (2009-2011, 2014, and 2019) for ten municipal entities in seven Russian regions, where one-, two-, three-, four-, five-, and ten-seat constituencies were used in municipal elections. The level of competition in these elections, voter activity, the percentage of invalid ballots, and the correlation between competition indicators, on the one hand, and voter activity and invalid ballots, on the other, are investigated. For multi-seat constituencies, an attempt is made to assess whether voters' choices are individual or partisan. A conclusion is made about the variety of models of electoral behavior in municipal elections in Russia. The methodology proposed in the paper can be used for extensive research of municipal elections.
The specific nature of local self-government is one of the most complex issues of constitutional and municipal law. The 1993 Constitution of the Russian Federation pronounced that local self-government bodies were not part of the system of bodies of state power. The 2020 constitutional amendments clarified that local self-government bodies and bodies of state power were part of a single system of public authority in the Russian Federation.
Over the course of three decades of post-Soviet development, the structural pattern of local self-government (LSG) went through repeated change [13; 14; 16]. The Federal Law No. 154-FZ of August 28, 1995, granted the regions wide-ranging authority in this matter, and the application patterns varied from region to region: in some cases LSG was organized at the settlement level, and at the district level in other. The Federal Law No. 131-FZ of October 6, 2003 largely established a two-level LSG system. In recent years, a number of regions started the process of getting rid the settlement level. The first regions to get rid of this level were Magadan and Sakhalin Oblasts, followed by Kaliningrad and Moscow Oblasts, Stavropol Krai, and the Udmurt Republic.
On December 16, 2020, senator Andrey A. Klishas and State Duma Deputy Pavel V. Krashennikov submitted to the State Duma a draft of federal law No. 40361-8 "On the general principles of organizing local self-government in a unified system of public authority". On January 25, 2022, the law was passed in the first reading, but the second reading is still pending. The bill provides for the complete dissolution of LSG at the settlement level as well.
In this regard, the special features of LSG remain a matter of debate. Are there fundamental, qualitative differences between local self-government and state government that dictate differences in the organization of these levels of public authority, or are these differences merely quantitative? Can we talk about a unified approach to the organization of local self-government, that would work for small dense settlements, for million-plus cities, and for huge districts all at once?
The problems that go hand in hand with LSG are those of municipal elections, which are necessary to form the representative bodies of municipalities and can also be used to elect heads of said units. Are there any special features to such elections, any qualitative differences from elections of higher level? Do they therefore require special legislative regulation, or can they be regulated by the same rules as elections to the bodies of state power?
These questions were raised in a virtual roundtable discussion organized by the editors of the Electoral Politics journal and published in its previous issue [1]. The participants of the roundtable gave different answers, but the quantitative approach prevailed overall. That is, the question was that municipal entities are smaller in territory and have smaller populations compared to the subjects of the Russian Federation, so the size of constituencies in municipal elections is smaller than in regional elections. It turns out that this is the root of the main specific features of local self-government – direct contact of candidates and deputies with voters (or, in other words, the accessibility of government bodies for direct communication, the level of "walking distance").
At the same time, the discussion emphasized vast differences between municipal entities of different levels. And we know that some municipal entities can actually equal other subjects of the Russian Federation in size of territory and/or population.
The most striking examples are million cities: Novosibirsk, Yekaterinburg and Nizhny Novgorod have over a million voters, while 45 regions of Russia have less than a million voters. As far as territory size is concerned, a telling example is the Taimyrsky (Dolgano-Nenetsky) Municipal Raion (Rus. for "district"), whose territory (880 thousand square kilometers) is larger than the territory of any region in the European part of Russia. That said, this raion includes two urban and two rural settlements, and even the smallest Karaul (101 thousand square kilometers) rural settlement occupies a larger area than 53 subjects of the Russian Federation.
At the same time, one of the experts noted that the technological differences in elections depend on the size of the constituency. More specifically, municipal elections in large constituencies are not fundamentally different from regional elections in similar-sized constituencies.
Some experts noted that the regional and municipal levels of organization of public authority differ in their powers. However, the differences in powers are the fruit of legislative decisions. And it is important for us to understand whether these differences are dictated by the differing nature of the levels of government under discussion, or are the result of the subjective will of legislators.
Some experts pointed out that in municipal elections, citizens are far more likely to choose the people they know personally, with little regard for who nominates them. And in state elections, party programs begin to play a big role. However, it is difficult to say to what extent this thesis is based on real-life analysis and to what extent it is based on theoretical perceptions.
It seems that these issues should be the subject of scholarly analysis that uses data from sociology and political science, including electoral statistics.
Russia is not the only country that has these issues. They are discussed in a number of publications concerning elections in other countries as well [3; 4; 7; 12]. At the same time, the Russian model of local self-government and Russian municipal elections possess certain specific features. Therefore, this article is limited to an analysis of the case of Russia alone.
Theoretical Musings
It is obvious there are quantitative differences between the municipal and regional levels, but, as noted above, they are not universal. Perhaps the highlighted exceptions are related to the solutions that were not exactly successful for the Russian case in particular. However, it is important for us to understand whether quantity is being transformed into quality. In other words, is there and should there be a fundamental (qualitative) difference between the municipal level and the level of state power? For only the presence of such a qualitative difference justifies the constitutional provision on the autonomy of local self-government.
In my view, the qualitative difference can and should be the absence of alienation between government and citizens at the municipal level. But then the next question is, then, how do we assess whether this alienation exists or not? I once found this attempt at an answer in a Moscow deputy: you can come to a government representative, and they will accept you. I do not think that is the point. I would say that there is no alienation when a citizen can meet a government representative outside of their office or outside of official events as well. That is, at a store, a sports ground, a dog park, a playground, in a parking lot or at a garage, at a parent-teacher meeting at school or just in the street. And on a regular basis, at that.
Here are two examples from my personal experience. The man we elected to the Moscow City Council in 1990 lives around where I do, and I still often meet him in the street. And in Rome, I heard the following story from our guide. She had problems registering her dog, so she shared it with one of the men she met at the dog park. She did not know where he worked, but it turned out that he was the deputy mayor (not of Rome, of course, but of one of its municipal subdivisions).
It seems to me that this criterion must be kept in mind when discussing the territorial organization of LSG. Here, however, we can see an immediate ambivalence. A deputy is one thing, but a mayor is a whole another matter. A deputy can be "one of ours" (in terms of the above-mentioned criterion) even in large entities (especially if the number of deputies is increased). The head person can be "one of ours" in a small municipal unit only.
On the other hand, a municipal entity cannot be too small, otherwise: 1) it will not have a critical mass of personnel ready and able to exercise power, and 2) the costs of maintaining the power structures will be disproportionately high. It would be very useful to make calculations that would determine the minimum population size in a municipal entity in terms of these criteria.
I believe that the issue of the optimal territorial organization of local self-government in Russia is yet to be resolved. One-level SG in districts, one-level in settlements, two-level only in rural areas, two-level in large cities — all these options still require theoretical and practical justification.
When discussing the organization of local self-government in Russia, it should be noted that notions were substituted at the time of the creation of this system. The Constitution uses the term "settlement." However, the meaning of the term "settlement" (Rus. "poseleniye") is equivalent to that of the term "populated locality" (Rus. "naselyonnyi punkt"). In reality, however, what got the name "rural settlement" usually turned out to be an amalgamation of several populated localities. An amalgamation that was sometimes natural, and other times artificial. The current "settlements" correspond most closely to the pre-revolutionary volosts; in Pskov Oblast they were called precisely that.
A number of experts hold the idea that the settlement is primary and everything else is secondary. However, this idea is based precisely on the notion of the settlement as a single populated locality, a single organism. But if a settlement is a number of artificially amalgamated populated localities, then the idea loses its meaning.
If we discuss the idea of dividing a large city into intracity municipal entities — the idea that was implemented in 2014-2015 in three regional centers — then it is directly related to the question formulated above: can the government of a million city avoid being alienated from its residents? It is likely that the deputies can (if their number is increased several times), but the mayor cannot. Abolishing direct mayoral elections is not a solution either.
Naturally, if one assumes that residents are not tied to one city district—they live in one, work in the other, shop in the third, have fun in the fourth, then the situation is deadlocked. I think, however, that in many cities there is a fairly clear natural division (Nizhny Novgorod, Perm, Togliatti, Sochi come to mind). Or there are individual suburbs that were quite artificially attached to the main city.
Therefore, I believe that the idea of creating intracity municipal entities should not be discarded. But, first, it should be done by the will of the residents themselves, and second, city councils should in no way be formed by delegation.
The geographic criteria for the formation of municipal entities should also be reconsidered. "Walking distance" is an indisputable anachronism. Once upon a time (about 60-80 years ago) people walked long distances. Now they do not; if one does not own a car, and bus service is scarce, one hitchhikes. There are also bicycles, scooters, motorbikes and motorcycles.
In any case, the best criterion is distance, but not by map, but by road. And the distance from the city center at that. Of course, travel time depends on the quality of the road, but there is no way to formalize it. Area size is not a good criterion (when forests, fields and rivers are taken into account).
Problem Statement
The issues raised above require analysis using the methods of different sciences — sociology, political science, cultural studies, and geography. In this paper, we will attempt to figure out what information about local self-government and municipal elections can be obtained through analyzing electoral statistics.
Voter activity — the share of voters who participated in the elections from the electoral roll — can be considered one of the more universal indicators. This indicator tells us about citizens' attitude to elections, including municipal elections.
Previously, we already pointed out that the activity of Russian voters in municipal elections is often lower than in regional elections and even more so in federal elections [8; 11: 135-145]. This is a sign that a considerable part of Russians does not consider municipal government to be "close to the people". However, lower voter participation in local elections is characteristic of many other countries as well [3; 4].
Nevertheless, there is a significant difference in activity between residents of large cities and rural settlements, and there are regional specifics as well. Although it is impossible not to take into account other factors affecting the official figures of turnout — from the tradition of going to the polls regardless of attitude to the elected bodies to outright election fraud.
An important indicator is the percentage of invalid ballots. Although it is often considered that invalid ballots are the result of voters making mistakes, a consequence of their low literacy, our experience tells us that after the "against all" vote was abolished, a significant number of invalid ballots became a manifestation of protest voting and first of all voter dissatisfaction with the choice offered [11: 200-208]. Therefore, the percentage of invalid ballots shows us voter attitudes toward the set of candidates on the ballot.
Another set of data are competition indicators. The easiest of those is the number of candidates per seat. We know that elections of municipal deputies in single-seat constituencies often turn out to be a Hobson's choice. And in multi-seat constituencies there are times when the number of candidates is only one more than the number of seats to be filled. But municipal elections with a large number of candidates still happen.
More interesting are the indicators of real competition, based on an analysis of vote returns. Two approaches are possible under the plurality voting system. One of them is the classical analysis of the effective number of candidates (ENC), which is most often calculated as the Laakso-Taagepera index. From our point of view, this index shows the competition for votes.
As for the competition for seats, the indicater can be either the more simply calculated difference between the results of the winner and their main rival (at the election of the head or in a single-seat constituency at the election of deputies), or (in a more general case) the difference between the last elected candidate by the number of votes and the first unelected candidate by the number of votes [11: 37-40].
As was noted earlier, the rank distributions of votes cast for candidates under free competition obey the Zipf-Pareto law, that is, the connection between the logarithm of the number or proportion of votes cast for candidates and the logarithm of their ranks turns out to be linear. At the same time, deviations from this connection are observed quite often, and not only as a result of election fraud, but also due to many other factors [2; 11: 100-101; 15].
Thus, multi-seat constituencies usually employ the so-called block system, when a voter has as many votes as the number of seats to be filled. Such a system encourages candidates to join into blocs (formal or informal) and to persuade voters to vote for the entire bloc. Such voting typically results in a "broom effect", and rank distributions can deviate significantly from the Zipf-Pareto law: candidates from one bloc get similar results, while candidates from another bloc or other blocs get much lower results and are also close to each other [6: 223-224].
Therefore, the analysis of rank distributions allows us to see whether the competition between candidates is individual or collective. What individual competition means is that voters focus on the personalities of candidates, while collective competition means focusing on certain teams (that is, party or quasi-party structures).
This paper aims to analyze how different indicators vary in municipal elections depending on various factors — the specific features of the region, the level and size of the municipal entity, the electoral system (single- or multi-seat constituencies), etc.
Sampling
The scope of one paper clearly cannot cover all municipal election taking place in Russia. Therefore, it is necessary to determine the sampling.
We selected seven regions from all federal districts (except the North Caucasus) — the Republic of Karelia, Perm Krai, Amur, Irkutsk, Rostov, Sverdlovsk and Tver Oblasts. When selecting regions, one of the main conditions was the absence of information about mass election fraud (Rostov Oblast was the only exception for this criterion).
We analyzed only elections of deputies and only under the plurality voting system in single-seat or multi-seat constituencies, where candidates have the opportunity to address voters directly. We also left out the cases of the mixed system.
One of our objectives is to trace the change in the situation over time. Therefore, we had to find the municipal entities that had data on three local elections. However, we decided not to look at the 2020-2022 elections because of the multiple days of voting. Moreover, our research required municipal elections that were not combined with federal and/or regional elections (which severely limited our choice of regions). As a result, we settled on the elections held from March 1, 2009 to March 13, 2011 (first cycle), September 14, 2014 (second cycle), and September 8, 2019 (third cycle).
In each of the selected regions, we searched for municipal elections held on the specified dates. Our task was to find different municipal entities: municipal raions, urban okrugs (rough translation from Rus. "township"), urban settlements, rural settlements. If a region included several municipal entities of the same type, where elections were held on the specified dates, only one was selected. However, we were only able to select 10 municipal entities — one from four regions, and two from three regions. They inclue three municipal raions, four urban okrugs, one urban settlement and two rural settlements.
The data on these municipalities and their electoral systems can be found in Table 1. As can be seen from the table, in seven municipal entities, the system remained unchanged over three cycles. In Ust-Ilimsky Urban Okrug, the changes were minimal: in 2014, the number of single-seat constituencies decreased from 25 to 20. Rameshkovsky Municipal Raion switched from seven constituencies (six two-seat and one three-seat) to three five-seat constituencies in 2014. Sivinsky Municipal Raion switched from 15 single-seat constituencies to eight constituencies (four single-seat, one two-seatand three three three-seat) in 2014 as well.
Table 1. Constituencies in the municipal entities selected for the study
| Region | Municipal entity | Status | Date of election | Number of | |||
| constituencies | seats in a constituency | voters in a constituency | |||||
| Republic of Karelia | Rabocheostrovskoye | rural settl. | 11.10.2009 | 10 | 1 | 175 - 227 | |
| 14.09.2014 | 10 | 1 | 167 - 218 | ||||
| 08.09.2019 | 10 | 1 | 99 - 219 | ||||
| Perm Krai | Polozovskoye | rural settl. | 13.03.2011 | 1 | 10 | 1819 | |
| 14.09.2014 | 1 | 10 | 1839 | ||||
| 08.09.2019 | 1 | 10 | 1590 | ||||
| Sivinsky | mun. raion | 01.03.2009 | 15 | 1 | 768 - 1010 | ||
| 14.09.2014 | 8 | 1 - 3 | 748 - 2591 | ||||
| 08.09.2019 | 8 | 1 - 3 | 716 - 2632 | ||||
| Amur Oblast | Skovorodino | urban settl. | 14.03.2010 | 3 | 5 | 2206 - 2448 | |
| 14.09.2014 | 3 | 5 | 2439 - 2681 | ||||
| 08.09.2019 | 3 | 5 | 2237 - 2751 | ||||
| Shimanovsk | urb. okrug | 14.03.2010 | 5 | 3 | 2981 - 3623 | ||
| 14.09.2014 | 5 | 3 | 2975 - 3462 | ||||
| 08.09.2019 | 5 | 3 | 2777 - 3197 | ||||
| Irkutsk Oblast | Bratsky | mun. raion | 11.10.2009 | 16 | 1 | 2603 - 3277 | |
| 14.09.2014 | 16 | 1 | 2629 - 3140 | ||||
| 08.09.2019 | 16 | 1 | 2326 - 2828 | ||||
The table is not fully displayed Show table
In general, our sample included a variety of options: one-, two-, three-, four-, and five-sear constituencies and a single ten-seat constituency.
It is also worth paying attention to the number of voters in the constituencies presented in the table. Rabocheostrovskoye Rural Settlement in Karelia stands out in partirular, where single-seat constituencies include about a hundred to two hundred voters. In the remaining municipal entities, constituencies include a few thousand voters with a maximum in Bataisk. But even there, only two districts accounted for just over five thousand in 2019, and even less in the first and second cycles at that. Thus, the number of voters in all constituencies is such that if they wished, the candidates could meet every single one of them during the campaign.
Naturally, this sampling cannot claim to fully cover the issues of municipal elections in Russia. Nevertheless, we believe it provides a good insight into many issues. At the same time, our study is still primarily methodological in nature.
Competition indicators
First of all, let us assess the formal indicators of competition. Table 2 presents data on the average number of candidates per seat at the beginning of the campaign (at the nomination stage) and at the final stage, that is, on the ballot.
Table 2. Formal indicators of competition
| Municipal entity | Date of election | Avg of candidates per seat | Dropout | |
| nominated | on the ballot | |||
| Rabocheostrovskoye | 11.10.2009 | 2.3 | 2.2 | 4% |
| 14.09.2014 | 2.5 | 2.4 | 4% | |
| 08.09.2019 | 2.1 | 1.9 | 10% | |
| Polozovskoye | 13.03.2011 | 2.5 | 2.5 | 0% |
| 14.09.2014 | 1.8 | 1.7 | 6% | |
| 08.09.2019 | 1.6 | 1.4 | 13% | |
| Sivinsky | 01.03.2009 | 3.5 | 3.4 | 2% |
| 14.09.2014 | 2.5 | 2.1 | 16% | |
| 08.09.2019 | 2.5 | 2.3 | 8% | |
| Skovorodino | 14.03.2010 | 2.1 | 1.9 | 10% |
| 14.09.2014 | 1.6 | 1.3 | 17% | |
| 08.09.2019 | 2.2 | 1.9 | 12% | |
| Shimanovsk | 14.03.2010 | 2.9 | 2.2 | 25% |
| 14.09.2014 | 2.0 | 1.9 | 7% | |
| 08.09.2019 | 2.3 | 2.3 | 3% | |
| Bratsky | 11.10.2009 | 4.4 | 3.0 | 31% |
| 14.09.2014 | 3.0 | 2.4 | 21% | |
| 08.09.2019 | 4.3 | 3.7 | 13% | |
The table is not fully displayed Show table
It should be noted at once that in most cases the dropout was insignificant. The maximum (31%) emerged in Bratsky Raion in 2009; a quarter or more of the candidates dropped out in Ust-Ilimsk and Verkhnyaya Tura in 2009 and in Shimanovsk in 2010.
Nevertheless, the average number of candidates per seat was low in most cases. In a number of cases it turned out to be less than 2: during all three cycles in Skvorodino Urban Okrug, in Polozovskoye Rural Settlement and Rameshkovsky Municipal Raion in 2014 and 2019, in Rabocheostrovskoye Rural Settlement in 2019, in Shimanovsky Urban Okrug in 2014. The largest number of candidates per seat (about four to five) emerged invariably in Ust-Ilimsk.
The party line-up of the candidates stirs up curiousity. Let us recall that seven parties were entitled to nominate candidates in 2009-2011, 69 in 2014, an 59 in 2019 [10]. Moreover, non-partisan public associations retained the right to nominate candidates in municipal elections. Nevertheless, non-parliamentary parties largely ignored elections in small municipal entities. That said, even the parliamentary parties did not run in all elections.
In 19 cases out of 30, only parliamentary parties nominated candidates (not including self-nominated candidates). At the same time, all four parties participated in only five elections: in Bataisk and Ust-Ilimsk in 2009, in Ust-Ilimsk, Verkhnyaya Tura, and in the Sivinsky Raion in 2019.
United Russia, CPRF and LDPR nominated candidates in Bratsky Raion in 2009, in Rameshkovskoi Raion in 2014, in Skovorodino in 2019 and in Verkhnyaya Tura in 2014; United Russia, LDPR and A Just Russia nominated candidates in Rabocheostrovskoye and Polozovskoye Rural Settlements in 2019. In another six cases, only two parties participated in the elections: in Rabocheostrovskoye Settlement in 2014, in Skovorodino in 2014, and in Rameshkovsky Raion in 2019. United Russia and LDPR in Polozovskoye Settlement in 2014. United Russia and CPRF in Skovorodino in 2010 and Sivinsky Raion in 2009. United Russia and A Just Russia. United Russia was the only party to nominate candidates in Rameshkovsky Raion and Verkhnyaya Tura in 2009. In the 2009 election in Polozovskoye Settlement, the parties did not run at all.
There are only 10 exceptions, meaning participation in elections by non-parliamentary parties or non-partisan public associations. Patriots of Russia nominated candidates in Shimanovsk in 2010, Bataisk and Ust-Ilimsk in 2014; Civic Platform in Bratsky Raion in 2014 and 2019 and in Bataisk in 2014; Communists of Russia in Bataisk in 2014 and in Shimanovsk in 2014 and 2019; Party of Growth in Bataisk in 2019; Rodina in Sivinsky Raion in 2014. The Kem Women NGO and the Kemsky Raion Organization of the Trade Union of Education and Science Workers of the Russian Federation took part in the 2009 elections in Rabocheostrovskoye Settlement.
Only self-nominated candidates ran in the 2011 election in Polozovskoye Settlement. Most of the candidates were self-nominated in Rabocheostrovskoye Settlement in 2014, in Bratsky, Rameshkovsky and Sivinsky Raions, and in Verkhnyaya Tura in 2009.
There was a marked percentage of self-nominated candidates in Ust-Ilimsk in all three cycles, in Bratsky Raion in 2014 and 2019, in Polozovskoye Settlement and Skovorodino in 2014, and in Bataisk, Shimanovsk and Sivinsky Raion in 2019. There were no self-nominated candidates whatsoever in Rabocheostrovskoye Settlement in 2009 and 2019. There were few self-nominated candidates in about half of the cases. As a result, municipal elections began to take on a partisan character as early as 2009.
Table 3 presents data on formal and real indicators of competition by constituencies. In this table, they are grouped mostly according to the number of seats in the constituency. It is thus clear that it makes sense to analyze this data individually for single-seat constituencies and multi-seat constituencies.
Here we should clarify the formula for calculating the ENC in multi-seat constituencies. One of the main properties of the ENC is that this index should be equal to the real number of candidates if they all receive an equal number of votes [5]. And this requires that the sum of the percentages of all candidates is equal to one. Therefore, to calculate the ENC in multi-seat constituencies, where a voter has more than one vote, the percentages of candidates were counted from the sum of the votes cast for all candidates (when a voter has one vote, this sum is inevitably equal to the number of valid ballots).
The abnormal situation in the Sivinsky Raion of Perm Krai deserves a special mention. As was noted above, an eight-constituency scheme was used here in 2014 and 2019 (four single-seat, one two-seat, and three three-seat constituencies). The legal requirement for such cases is for voters in all constituencies to have one vote. But in 2014, this legal requirement was not met, and voters in the two-seat and three-seat constituencies voted for more than one candidate. The violation was noticed after the elections through the analysis of electoral statistics, but the parties did not appeal the election results and the case was hushed up. In 2019, voting already complied with the law — one vote for all voters.
Another necessary caveat: in calculating the gap between elected and unelected candidates, for ease of calculation, percentages of votes from the number of valid ballots were used rather than from the more usual number of voters who took part in the election.
So, what does Table 3 show us? We will start with single-seat constituencies. In each of the municipal entities with single-seat constituencies, there were constituencies with a fairly high level of competition, where the gap between the winner and the main rival did not exceed 6%, and the value of the ENC equalled at least 2, and in some cases (Ust-Ilimsk in 2009) reached 6. And in every such municipal entity there were constituencies with a low competition levels, where the gap exceeded 30%, sometimes 90%, and the ENC was below 2, dropping in some cases to 1.1. Rabocheostrovskoye Settlement had two non-alternative constituencies in both 2009 and 2019. The average level of competition was most often not very high. The average gap was 12% only in Ust-Ilimsk in 2019, exceeding 20% in other cases. The average ENC value most often did not exceed 3.
Table 3. Competition indicators by constituency
| Municipal entity | Date of election | Constituency size | No. of cand. in the constituency | ENC | Gap | ||||||
| min | avg | max | min | avg | max | mid | avg | max | |||
| Rabocheostrovskoye | 11.10.2009 | 1 | 1 | 2.2 | 3 | 1.74* | 2.18* | 2.91* | 1.3%* | 20.8%* | 38.5%* |
| 14.09.2014 | 1 | 2 | 2.4 | 3 | 1.15 | 1.88 | 2.43 | 4.3% | 34.7% | 86.4% | |
| 08.09.2019 | 1 | 1 | 1.9 | 3 | 1.58* | 1.86* | 2.00* | 3.4%* | 27.8%* | 51.6%* | |
| Bratsky | 11.10.2009 | 1 | 2 | 3.0 | 6 | 1.26 | 2.31 | 4.35 | 2.5% | 32.5% | 76.6% |
| 14.09.2014 | 1 | 2 | 2.4 | 4 | 1.37 | 1.95 | 2.76 | 4.1% | 30.2% | 75.5% | |
| 08.09.2019 | 1 | 2 | 3.7 | 5 | 1.38 | 2.83 | 4.40 | 0.4% | 21.9% | 67.2% | |
| Ust-Ilimsk | 11.10.2009 | 1 | 2 | 3.9 | 7 | 1.51 | 2.99 | 6.09 | 2.3% | 24.3% | 69.3% |
| 14.09.2014 | 1 | 2 | 4.1 | 8 | 1.08 | 2.73 | 4.76 | 1.0% | 23.9% | 92.5% | |
| 08.09.2019 | 1 | 3 | 5.2 | 8 | 2.16 | 3.47 | 5.06 | 0.5% | 12.2% | 35.2% | |
| Bataisk | 11.10.2009 | 1 | 2 | 2.5 | 4 | 1.19 | 1.83 | 2.90 | 5.4% | 44.5% | 82.8% |
| 14.09.2014 | 1 | 2 | 3.9 | 6 | 1.10 | 2.54 | 4.01 | 0.9% | 29.2% | 90.5% | |
| 08.09.2019 | 1 | 2 | 4.3 | 6 | 1.33 | 2.79 | 4.03 | 0.7% | 20.9% | 70.8% | |
| Sivinsky | 01.03.2009 | 1 | 2 | 3.4 | 5 | 1.32 | 2.16 | 3.14 | 5.1% | 36.7% | 71.5% |
| 14.09.2014 | 1 | 2 | 3.0 | 4 | 1.86 | 2.00 | 2.12 | 5.2% | 20.3% | 51.2% | |
| 2 | 3 | 2.91 | 13.9% | ||||||||
| 3 | 4 | 5.7 | 7 | 3.34 | 4.92 | 5.74 | 4.4% | 17.9% | 41.2% | ||
| 08.09.2019 | 1 | 2 | 2.75 | 4 | 1.72 | 2.11 | 2.68 | 5.7% | 22.9% | 40.4% | |
| 2 | 5 | 2.88 | 1.4% | ||||||||
The table is not fully displayed Show table
* The ENC and gap values are given without taking into account the non-alternative constituencies.
In multi-seat constituencies, the situation with competition was often better. For example, we can see that in Skovorodino, the maximum values of the gap between the last elected candidate and the first unelected candidate did not exceed 5%, and the minimum values were below 1%. And overall, the average values of the gap most often did not exceed 10%. The ENC values were also often quite high, not significantly different from the formal number of candidates, indicating a fairly even distribution of votes among the candidates.
The dynamics of competition indicators are intriguing. You cannot see a general trend here. Compared to 2009-2011, in 2014, all average indicators improved in Bataisk and worsened in Shimanovsk and Polozovskoye Settlement. The average ENC value decreased in most cases — except for Shimanovsk and Polozovskoye Settlement — including in Rabocheostrovskoye Settlement, Bratsky Raion, Ust-Ilimsk, Verkhnyaya Tura, and Skovorodino. As for the average gap, it increased only in Rabocheostrovskoye Settlement and Verkhnyaya Tura, in addition to Shimanovsk and Polozovskoye Settlement.
Compared to 2014, in 2019, all indicators improved in five municipal entities out of ten: in Bratsky and Rameshkovsky Raions, Ust-Ilimsk, Bataisk and Shimanovsk. In Rabocheostrovskoye and Polozovskoye Settlements, the average value of the ENC decreased, but the average value of the gap decreased as well. In contrast, in Verkhnyaya Tura and Skovorodino, the average ENC value increased, but the average gap value also increased. In Sivinsky Raion, the situation was different depending on the constituency.
But overall, we see more of an improvement in competitive performance.
Voter activity and invalid ballots
The data on voter activity (the percentage of voters who participated in the elections from the list of voters) and the percentage of invalid ballots (from the number of voters who participated in the elections) are presented in Table 4. Overall, we see low turnout values. Only in Polozovskoye Settlement in 2011 and 2014 the average turnout was slightly above 50%; in other cases, the average turnout was lower, as much as 19.8% in Bataisk in 2014.
Table 4. Voter activity and percentage of invalid ballots by constituency
| Municipal entity | Date of election | Turnout | Invalid ballots | ||||
| min | avg | max | min | avg | max | ||
| Rabocheostrovskoye | 11.10.2009 | 24.0% | 35.5% | 46.3% | 2.0% | 11.1% | 38.0% |
| 14.09.2014 | 25.5% | 40.5% | 56.9% | 2.2% | 5.0% | 9.1% | |
| 08.09.2019 | 12.0% | 25.9% | 46.1% | 0.0% | 10.4% | 35.0% | |
| Polozovskoye | 13.03.2011 | 51.4% | 0.7% | ||||
| 14.09.2014 | 50.4% | 1.2% | |||||
| 08.09.2019 | 44.7% | 3.1% | |||||
| Sivinsky | 01.03.2009 | 29.8% | 43.9% | 57.7% | 0.6% | 2.2% | 5.2% |
| 14.09.2014 | 17.8% | 23.3% | 30.1% | 0.0% | 2.1% | 4.1% | |
| 08.09.2019 | 23.6% | 27.6% | 32.5% | 0.5% | 2.6% | 5.9% | |
| Skovorodino | 14.03.2010 | 22.4% | 26.1% | 28.2% | 3.4% | 4.0% | 5.1% |
| 14.09.2014 | 19.4% | 26.9% | 31.8% | 6.0% | 6.4% | 6.8% | |
| 08.09.2019 | 15.5% | 20.6% | 24.2% | 6.7% | 7.7% | 8.5% | |
| Shimanovsk | 14.03.2010 | 29.7% | 33.3% | 39.6% | 4.1% | 5.0% | 6.0% |
| 14.09.2014 | 21.5% | 23.6% | 26.1% | 3.6% | 4.0% | 4.2% | |
| 08.09.2019 | 21.3% | 23.6% | 25.8% | 4.0% | 5.2% | 6.5% | |
| Bratsky | 11.10.2009 | 20.9% | 39.7% | 61.4% | 2.6% | 6.1% | 11.1% |
| 14.09.2014 | 22.3% | 32.4% | 41.6% | 2.3% | 7.6% | 14.9% | |
| 08.09.2019 | 9.4% | 22.7% | 34.0% | 2.4% | 5.9% | 18.6% | |
The table is not fully displayed Show table
We recorded a minimum turnout (9.4%) in one of the single-seat constituencies in the Bratsky Raion in 2019. The turnout was the highest (73.5%) in one of thesingle-seat constituencies of Bataisk in 2009.
The level of invalid ballots varied within fairly wide limits. The Rabocheostrovskoye settlement is distinctive in this respect. In this case, one constituency (No. 8) did not have any invalid ballots in 2019, but more than a third (7 out of 20) of ballots were invalid in another constituency (No. 10). The rate of invalid ballots in constituency No. 7 in 2009 was even higher — 19 out of 50 (38%).
We see a high, though not that high, rate of invalid ballots in some constituencies of Bratsky and Bataysky Raions. The average rate in Bratsky Raion (6-8%) can also be considered quite high. At the same time, in Rameshkovsky and Sivinsky Raions, the rate did not exceed 2% and 3%, respectively.
The turnout dynamics were quite expressive. In eight cases out of ten, the average values of turnout in 2014 decreased compared to 2009-2011 (the exceptions are Rabocheostrovskoye Settlement and Skovorodino, in the latter case the turnout increased by only 0.8%). It is clearly connected to the changed voting day: in 2009-2011, elections were held in March or October, while and in 2014, they were held in September. The next electoral cycle no longer followed the same trend: the turnout decreased in five cases and it increased or remained at the same level in the other five. If we compare 2019 with 2009-2011, there was a decrease in nine out of ten cases (the exception is Verkhnyaya Tura).
The trends are different for invalid ballots. In 2014, the average increased compared to 2009-2011 in four cases and decreased in six. But in 2019, the average percentage of invalid ballots increased in nine cases out of ten (Bratsky Raion is the exception).
Is there a connection between turnout and invalid ballots, on the one hand, and the competition indicators described in the previous section? From theoretical considerations, we can assume that the more intense the competition, the more interest voters have in the elections and the stronger the motivation of candidates to bring as many of their supporters to the polls as possible. Therefore, competition should help increase turnout.
The invalid ballots situation is more complex. If voting by invalid ballots is the result of errors, the more candidates there are, the more such errors can be expected. On the other hand, if invalid ballots are used by voters as a form of protest, then an increase in invalid ballots is to be expected in the context of insufficient competition . At the same time, our experience shows that when the level of invalid ballots is low, they are more likely the result of errors, while a high level is the consequence of protest behavior [11: 200-208].
We tested our hypotheses for municipal entities with a large number of single-seat constituencies (at least 15), that is, Bratsky Raion, Ust-Ilimsk and Bataisk, as well as for Sivinsky Raion in 2009. However, we detected no significant correlations for three campaigns (Bratsky Raion in 2009 and 2019, Ust-Ilimsk in 2019).
Only the elections in Bataisk indicated significant (in terms of the 5% criterion) correlations between competition and turnout. Paradoxically, our hypothesis did not find confirmation in this case. The correlations between turnout and the number of candidates and with the ENC were negative, while the correlations between turnout and the gap were positive. A significant correlation between turnout and the number of candidates was detected only in 2009 (-0.55), between turnout and the ENC — in all three campaigns (-0.62, -0.42 and -0.43, respectively), between turnout and the gap — in all three campaigns (0.60, 0.40 and 0.45, respectively) as well.
In other words, the stronger the actual competition, the lower the turnout. The 2009 elections may be taken as an example, when the highest turnout (73.5%) was in constituency no. 13 with two running candidates: the ENC and the gap stood at 1.59 and 51%, respectively. High turnout (70.5, 69.6, 69.0, 68.3, and 67.9%, respectively) was also detected in constituencies no. 15, 11, 23, 25, and 7, with two running candidates as well, with the ENC and the gap standing at 1.19-1.84 and 29.3-82.7%, respectively. At the same time, in the two constituencies with four running candidates each (no. 6 and no. 21), the ENC stood at 2.62 and 2.90, and the gap at 5.4 and 34.2%, and the turnout was several times lower at 25.5 and 24.3%.
The only explanation for this phenomenon is that a highly competitive environment ensures that the voting and counting processes are under control to prevent fraud. And when the actual competition is lacking, turnout is inflated by administrative methods.
We observe the opposite in Sivinsky Raion and Ust-Ilimsk in 2009 as well, although they fall short of the 5% significance level. Thus, the correlation between turnout and the number of candidates was 0.36 and 0.43 in Ust-Ilimsk and Sivinsky Raion, respectively. The correlation between turnout and the ENC in Ust-Ilimsk amounted to 0.34. The correlation between turnout and the gap in Ust-Ilimsk turned out to be -0.29, and -0.33 in Sivinsky Raion.
Significant correlations between the percentage of invalid ballots and competition indicators were only negative. The most frequent correlations were with the number of candidates: Bataisk in 2014 (-0.46), Bratsky Raion in 2014 (-0.48), Ust-Ilimsk in 2009 (-0.59), Ust-Ilimsk in 2014 (-0.56), and Sivinsky Raion in 2009 (-0.66). In Ust-Ilimsk in 2009 and 2014, there were significant correlations between the percentage of invalid ballots and the ENC (-0.54 and -0.52). This data shows that the percentage of invalid ballots decreases as competition increases, meaning it confirms the protest nature of voting with invalid ballots.
The opposite trend was observed in 2009 and 2014 campaigns in Bataisk and Bratsky Raion, respectively, where we detected negative correlations between the invalid ballots percentage and the gap: -0.56 and -0.58, respectively. This is where we assume manipulations may have taken place.
Bloc voting
As was noted in the "Problem Statement" paragraph, in multi-seat constituencies, where the number of votes the voter has is equal to the number of seats to be filled, so-called bloc voting is possible. Bloc voting implies a significant number of voters who all together vote for a bloc of candidates united either by party affiliation or by some less formal characteristics (these may be campaign materials in which voters are encouraged to vote for a particular group of candidates [9: 134-139]). How is bloc voting reflected in the electoral statistics?
First of all, it should be noted that not all voters in multi-seat constituencies use all the votes granted to them. In this regard, an important indicator is the vote use coefficient (VUC), which is the ratio of the sum of votes for all candidates to the number of valid ballots divided by the number of votes granted to the voter [11: 82-85]. This coefficient may vary from one divided by the number of votes a voter has (if all voters use only one vote) to one (or 100%) if voters use all votes.
Our analysis shows that this coefficient was not high in most of the cases considered (see Table 5). It was lowest in the ten-seat constituency of Polozovskoye Settlement (up to 22% in 2019), and quite high values (over 80%) were obtained in some three-seat constituencies of Shimanovsk and four-seat constituencies of Verkhnyaya Tura. In fact, low VUC values imply either no bloc voting, or the bloc includes fewer candidates than the number of seats to be filled [6: 228-237].
Table 5. Vote use coefficient in multi-seat constituencies
| Municipal entity | Date of election | Constituency size | VUC | ||
| min | avg | max | |||
| Shimanovsk | 14.03.2010 | 3 | 64.9% | 70.1% | 72.7% |
| 14.09.2014 | 3 | 67.0% | 75.4% | 85.2% | |
| 08.09.2019 | 3 | 72.3% | 74.2% | 75.5% | |
| Verkhnyaya Tura | 01.03.2009 | 4 | 53.4% | 61.2% | 67.1% |
| 14.09.2014 | 4 | 64.6% | 66.7% | 70.4% | |
| 08.09.2019 | 4 | 77.4% | 79.3% | 81.3% | |
| Skovorodino | 14.03.2010 | 5 | 50.9% | 57.5% | 61.8% |
| 14.09.2014 | 5 | 34.7% | 42.7% | 56.6% | |
| 08.09.2019 | 5 | 47.7% | 52.7% | 57.9% | |
| Rameshkovsky | 14.09.2014 | 5 | 58.7% | 65.0% | 71.6% |
| 08.09.2019 | 5 | 52.8% | 59.8% | 66.6% | |
| Polozovskoye | 13.03.2011 | 10 | 33.7% | ||
| 14.09.2014 | 10 | 30.6% | |||
| 08.09.2019 | 10 | 22.2% | |||
As was noted in the "Problem Statement" paragraph, the rank distributions (the dependence of the logarithm of a candidate's result, whether in absolute or relative terms, on the logarithm of the place occupied) should ideally meet the Zipf-Pareto equation, that is, they should be linear. This rarely ever happens in reality. An example of a fairly good implementation of the Zypf-Pareto equation are the results of voting in the five-seat constituency no. 1 in the elections to the Council of People's Deputies of Skovorodino in 2010 (see Fig. 1). Ten candidates ran in the constituency; the first-place candidate received 237 votes (45.5%), the last elected candidate (5th place) received 164 votes (31.5%), and the next to finish (6th place) received 141 votes (27.1%). The eighth and ninth places were split between two candidates with 116 votes (22.3%), and only the outsider (10th place) had a steeper drop with 76 votes (14.6%). The graph shows the points are quite well approximated by a linear relationship, that is, the decrease in results from the leader to the outsider is quite uniform.
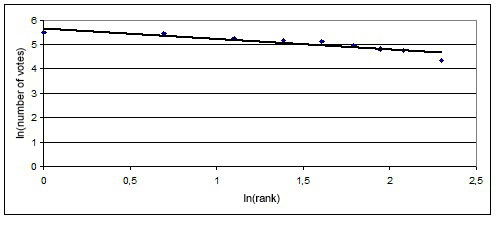
Figure 1. Dependence of the logarithm of the number of votes for a candidate on the logarithm of its rank for constituency no. 1 in the 2010 elections to the Council of People's Deputies of Skovorodino, Amur Oblast.
In this case, it is worth noting that the first, second and fourth places (as well as the sixth and seventh) went to United Russia candidates, and the third and fifth (as well as the eighth and ninth) to A Just Russia candidates. The last place was taken by a self-nominated candidate. The graph shows that the voting was individual rather than partisan.
In most cases, similar graphs did not fit into a linear relationship indicating obvious curvatures and breaks. For example, in five-seat constituency no. 3 in Skovorodino in 2010, the situation was entirely different (see Fig. 2): three candidates received almost identical results (275, 274, and 271 votes, 43.7-43.0%), and the results of the remaining candidates were much lower (186-135 votes, 29.5-21.4%) and declined almost linearly. What we see here is bloc voting, but not for five, but only for three candidates (all three are from United Russia, with the fourth and fifth places taken by their fellow party members as well, and the sixth and eighth places taken by A Just Russia candidates).
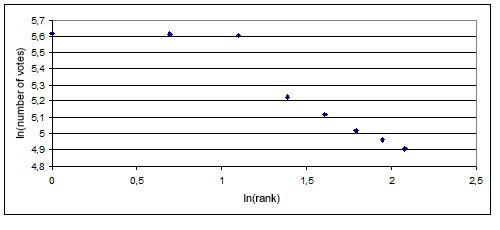
Figure 2. Dependence of the logarithm of the number of votes for a candidate on the logarithm of its rank for constituency no. 3 in the 2010 elections to the Council of People's Deputies of Skovorodino, Amur Oblast.
A striking example of bloc voting for five candidates can be seen in the vote returns in the five-seat constituency no. 1 of Rameshkovsky Raion in 2019 (Fig. 3). Here, the five elected candidates (all from United Russia) received between 883 (53.4%) and 671 votes (40.5%), while the other three (two self-nominated candidates and one LDPR candidate) received between 157 (9.5%) and 97 votes (5.7%).
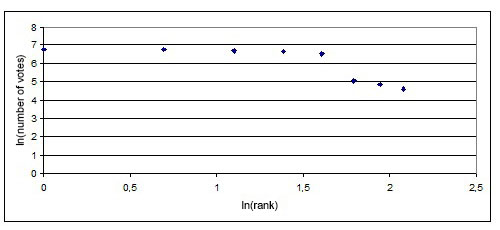
Figure 3. Dependence of the logarithm of the number of votes for a candidate on the logarithm of its rank for constituency no. 1 in the 2010 elections to the Council of Deputies of Rameshkovsky Raion, Tver Oblast.
So far it is difficult for us to offer quantitative indices for assessing bloc voting. However, a qualitative assessment can be made based on the data on vote gaps. On the one hand, we calculate the gap between the percentage of votes for the last elected candidate and the first unelected candidate. On the other hand, we can calculate the gap within the winning group, that is, between the leader and the last elected candidate. A comparison of these gaps shows how large the gap between the group of elected candidates and the rest is.
Our analysis reveals the following pattern. More often than not, the gap within the elected group was larger than the gap between the last elected and the first unelected. The highest ratio (116) was in constituency no. 2 in Shimanovsk in 2014 (the gap between first and third place was 17.3%, and 0.1% (a single vote) between third and fourth place). This ratio was also greater than one in all cases in Skovorodino, in Polozovskoye Settlement in all three cycles, in all Verkhnyaya Tura constituencies in 2009, in Verkhnyaya Tura constituencies no. 3 and 4 in 2014, in Verkhnyaya Tura constituency no. 4 in 2019, in Rameshkovsky Raion constituency no. 3 in 2014, in Rameshkovsky Raion constituency no. 2 and 3 in 2019, in Shimanovsk constituencies no. 1-4 in 2010, in Shimanovsk constituency no. 3 in 2014 and in all Shimanovsk constituencies in 2019.
The opposite results were observed in Verkhnyaya Tura constituencies no. 1 and no. 2 in 2014, Verkhnyaya Tura constituencies no. 1, no. 2 and no. 3 in 2019, Rameshkovsky Raion constituencies no. 1 and no. 2 in 2014, Rameshkovsky Raion constituency no. 1 in 2019, Shimanovsk constituency no. 5 in 2010, Shimanovsk constituencies no. 1, no. 4 and no. 5 in 2014. In this case, the lowest ratio (0.15) was in Shimanovsk constituency no. 5 in 2014 (the gap of 1.9% between first and third place and 12.6% between third and fourth place). That is, the 2014 election in Shimanovsk provided us with contrasting examples of bloc and non-bloc voting.
Conclusion
Municipal elections, especially in a country as vast as the Russian Federation, are very diverse. Regional specifics, differences in the degree of urbanization (from million cities to rural settlements), differences in the size of territories and population, etc. all play a role here. The electoral systems used in municipal elections are varied, and so is the size of constituencies and the number of seats to be filled in them.
Therefore, it is not possible to describe municipal elections in Russia with the help of just one model. A detailed research program is required in order to create a relatively balanced understanding of municipal elections. Different methodological approaches should be used depending on the aspects under study.
In this paper, we have attempted to identify methodological approaches to studying municipal elections using electoral statistics. These approaches allow us to assess the level of competition in elections, its impact on voter activity and protest behavior. We can also assess the extent to which voters are guided by individual and collective (including partisan) choices.
These issues are closely related to the problem of characteristic features of local government and municipal elections. It is the ability of voters to make individual choices based on personal knowledge of candidates at the municipal level that can justify the distinction of local government into a special category of public authority, which marks it apart from the higher level of government. If the choice is marked by partisan preferences alone, then it is quite difficult to talk about local government specifics.
We believe that the approaches outlined in this paper can be used for extensive analysis of municipal elections.
Received 15.10.2022, revision received 14.11.2022.
References
- Balabanova O.V., Kiselyov K.V., Kovin V.S., Kryzhov S.B., Rusakova E.L., Cherepanova A.F., Cherepanova K.F., Chernikov V.A., Shavshukova N.V., Shapiro L.V. The Distinctive Nature of Local Governments and Municipal Elections. – Electoral Politics. 2022. No. 1 (7). P. 5. - http://electoralpolitics.org/en/articles/spetsifika-mestnogo-samoupravleniia-i-munitsipalnykh-vyborov/
- Blagoveshchensky Yu.N., Vinyukov I.A. Vozmozhnosti statistiki v obnaruzhenii narushenii (vybory v Dumu–2003) [The Potential of Statistics in Revealing Election Fraud (2003 State Duma Election)]. – Internet-monitoring vyborov v Gosdumu 2003 (grazhdanskaya initsiativa Proyekta "Informatika dlya demokratii – 2000+") [Internet Monitoring of the 2003 State Duma Election (A Civic Initiative of the "Information Technology for Democracy – 2000+" Project)]. Materialy 3-i nauch.-prakt. konf. Proekta. Moscow: Fond INDEM, 2004. P. 249–261. (In Russ.)
- Brennan J. Increasing Voter Turnout in Local Elections. – National Civic Review. 2020. Vol. 109. No. 1. P. 16–23.
- Gendzwill A., Steyvers K. Comparing Local Elections and Voting: Lower Rank, Different Kind… or Missing Link? – ECPR Joint Sessions UCL, Mons, 08–12 April 2019. URL: https://ecpr.eu/Events/Event/PanelDetails/7676 (accessed 14.11.2022). - https://ecpr.eu/Events/Event/PanelDetails/7676
- Golosov G.V. Fragmentatsiya partiynykh sistem: noviy metod izmereniya i yego primeneniye k rezultatam vyborov rossiyskikh regionalnykh zakonodatelnykh sobraniy (2003–2008) [Party System Fragmentation: Applying a New Assessment Method to Regional Legislative Assembly Election Results (2003–2008)]. – Elektoralnoye prostranstvo sovremennoi Rossii. Politicheskaya nauka: Yezhegodnik 2008. Moscow: ROSSPEN, 2009. P. 9–26. (In Russ.)
- Golosov G.V. Rossiyskaya partiynaya sistema i regionalnaya politika, 1993–2003 [Russia's Party System and Regional Politics, 1993–2003]. Sankt-Peterburg: Evrop. un-t v Sankt-Peterburge, 2006. 300 p. (In Russ.)
- Jackson L.Toward a Theory of Local Elections: Building a Theoretical Framework by Analyzing School Bond Elections. Dissertation. University of Texas at Dallas. 2017. 91 p. URL: https://utd-ir.tdl.org/bitstream/handle/10735.1/5400/ETD-5608-7474.08.pdf (accessed 14.11.2022). - https://utd-ir.tdl.org/bitstream/handle/10735.1/5400/ETD-5608-7474.08.pdf
- Lyubarev A.E. Aktivnost izbiratelei na federalnykh, regionalnykh i munitsipalnykh vyborakh v Rossiyskoi Federatsii [Voter Activity in Federalm Regional and Municipal Elections in the Russian Federation]. – NB: Problemy obshchestva i politiki. 2013. No. 8. P. 138–209. DOI: 10.7256/2306-0158.2013.8.8778. (In Russ.) - https://e-notabene.ru/pr/article_8778.html
- Lyubarev A.E. Izbiratelnyye sistemy: rossiiskii i mirovoi opyt [Electoral Systems: Russian and International Experience]. Moscow: ROO "Liberalnaya missiya"; Novoye literaturnoye obozreniye. 2016. 632 p. (In Russ.)
- Lyubarev A.E. Russia's Party System Following the 2012 Reform. – Electoral Politics. 2020. No. 2 (4). P. 1. - http://electoralpolitics.org/en/articles/rossiiskaia-partiinaia-sistema-posle-reformy-2012-goda/
- Lyubarev A. Zanimatelnaya elektoralnaya statistika [Entertaining Election Statistics]. Moscow: Golos Consulting, 2021. 304 p. (In Russ.)
- Oliver J.E., Ha S.E., Callen Z. Local Elections and the Politics of Small-Scale Democracy. Princeton University Press, 2012. 240 p.
- Sergeyev A.A. Federalizm i mestnoye samoupravleniye kak instituty rossiyskogo narodovlastiya [Federalism and Local Self-Government as Institutions of People Power in Russia]. Moscow: Yurisprudentsiya, 2005. 256 p. (In Russ.)
- Shugrina Ye.S. Munitsipalnoye pravo: uchebnik [Municipal Law: A Textbook]. 5th ed., revised. Moscow: Norma: INFRA-M, 2014. 576 p. (In Russ.)
- Sobyanin A.A., Sukhovolsky V.G. Demokratiya, ogranichennaya falsifikatsiyami [A Democracy Bound by Election Fraud]. Moscow: Proyektnaya gruppa po pravam cheloveka. 1995. P. 52–73. (In Russ.)
- Zevina O.G., Kovalevsky A.E., Makarenko B.I., Maksimov A.N., Mironov N.M., Mikheyev S.A., Shavishvili D.F. Mestnoye samoupravleniye v Rossii: sostoyaniye, problemy, puti sovershenstvovaniya. Itogovy doklad [Local Self-Government in Russia: Its State, Issues, and Improvement Opportunities. Final Report]. Moscow: Ekon-Inform, 2009. 524 p. (In Russ.)