 Arkadii E. Lyubarev
Candidate of Biological Sciences and Candidate of Legal Sciences, [email protected]
2016 and 2021 State Duma Elections: An Evaluation of Vote Overflows
Abstract
Using correlation and regression analyses, the author examines the correlation between the differences in the results of political parties in the 2016 and 2021 State Duma elections. The resulting data is interpreted as evidence of votes overflowing from parties in the 2016 election to parties in the 2021 election. For most regions, vote overflow direction has been indicated as follows: from United Russia to CPRF and New People; from LDPR to CPRF and New People; from a group of "minor" parties (Yabloko, Party of Growth, PARNAS, Rodina, Civic Platform, Civilian Power) to New People, Green Alternative and Russian Party of Freedom and Justice. Moscow, Moscow Oblast and Saint-Petersburg indicated no vote overflow from LDPR to New People and CPRF, although there is a clear overflow from liberal parties to CPRF.
Comparing the results of two consecutive elections of the same type is always an intriguing process. Even the simplest analysis paints a certain picture, namely the gains and losses of various parties. The next intriguing point is trying to figure out the correlation between the increased and decreased support for various parties. This is where statistical analysis methods come in handy.
Such an analysis may yield especially intriguing results in case of a newly emerged party receiving significant voter support. This is exactly what happened in the 2021 State Duma election. Fourteen parties participated in this election, like in the previous election of 2016. That said, 11 parties remained the same in both cases. Three parties that ran in 2016 — PARNAS, Patriots of Russia and Civilian Power — did not run in 2021. However, we have to keep in mind that their results in 2016 were insignificant, with 0.7, 0.6 and 0.1% respectively. The three parties were replaced by two new ones (New People and Green Alternative) and one that underwent rebranding and a change of leadership: Russian Party of Freedom and Justice (RPSS), previously known as the Communist Party for Social Justice (KPSS, whose acronym mimicked that of the Communist Party of the Soviet Union). The performance of Green Alternative and RPSS left much to be desired (0.6% and 0.8% respectively), while New People actually gained 5.3% and made it into the State Duma.
Moreover, certain parties saw an increase in support compared to their 2016 performance: 5.6% increase for CPRF, 1.2% for A Just Russia, 0.7% for Party of Pensioners and 0.15% for REP The Greens. On the other hand, some parties suffered losses: United Russia (4.4%), LDPR (5.6%), Yabloko (0.65%), Communists of Russia (1.0%), Rodina (0.7%), Party of Growth (0.8%) and Civic Platform (0.07%) [8].
This paper attempts to understand the correlation between these results and assess the vote overflow between the parties that participated in the State Duma elections. For these purposes, correlation and regression analyses are applied.
Methodological Concerns
Vote overflow assessment is one of the primary concerns of electoral sociology. In Russia, it has long been a subject of academic interest. The first work that should be mentioned is that of Myagkov et al. [14], which proposed a statistical method for calculating the vote overflow. This method was used to assess the vote overflow between the 1999 and 2003 State Duma elections, as well as between the State Duma and presidential elections.
The proposed model was based on solving a system of equations using the method of weighted least squares. The variables used were the proportions of votes for parties (or candidates) from the voter roll for each territorial election commission (TEC), as well as the proportions of non-voters, with the voter roll considered as a constant. The result was a matrix that contained the coefficients of vote overflows from one party to another, as well as from non-voters to parties and vice versa.
The results of this study drew the interest of experts and did not receive any significant criticism [5]. However, the study did not get any actual follow-up, except for attempts to use the vote overflow model to analyze election fraud [7; 13]. Another noteworthy point is that the study did not assess the accuracy of the results.
A number of recent papers have discussed vote overflow between the 2014 and 2019 Moscow City Duma elections [1; 2; 3; 11]. However, these elections were held under the plurality voting system, so the methodological approaches to the study of vote overflow in this scenario are rather unconventional.
We believe there are several reasons why the level of accuracy of vote overflow assessment in Russian elections cannot be high. One reason is the instability of the electorate. If we are attempting to assess the vote overflow between elections that took place within five years of each other, we need to consider that a significant number of people die within this time frame in Russia. For example, about 9.5 million people died between 2016 and 2020 [4], and most of them were eligible to vote. At the same time, Russian citizens born between 1998 and 2002 reached the age of 18; their number can be estimated at about 6 million. As a result, over five years, the electorate has seen a renewal of about 6–8% through natural factors alone. Naturally, there is a relative matter of vote "overflow" in this case as well. However, our concern of how the same voters change their political alignment is joined by the concern regarding the "overflow" of votes from the deceased elderly voters to the young voters who have come of age. The nature of the second concern is entirely different.
Migration should be added to this list as well: over two million people arrive in Russia every year, and about the same number leave the country. However, a large number of those arriving do not become voters, while those leaving do not lose their right to vote. Internal migration is much more significant, as it strongly affects the number of voters in certain territorial election commissions (TEC), constituency election commissions (CoEC) and regions. With that said, our calculations show that the change in the number of voters between the 2016 and 2021 CoEC summary tables compiled by Russia's Central Election Commission (CEC) ranged from ‑11.6% (Yeniseisky constituency No. 57, Krasnoyarsk Krai) to 28.6% (Krasnoarmeisky constituency No. 47, Krasnodar Krai). Overall, 54 constituencies displayed a decrease of over 5%, while 32 constituencies displayed an increase of over 5%.
Another reason for the low accuracy of calculations lies in the region- and locality-specific features the voting has in certain elections. These features can be attributed to multiple factors — emergence or, on the contrary, resolution of conflicts within political elites in the region, a popular local politician siding with a party for a campaign. Among the 2016 examples are the relatively high results of the Patriots of Russia in Krasnoyarsk Krai and the Party of Growth in Saint Petersburg. The 2021 examples include the relatively high results of Yabloko in Arkhangelsk Oblast and Rodina in Tambov Oblast. Another worthy example is the significant change in vote returns in Khabarovsk Krai that followed Sergei Furgal's win in the gubernatorial election and his subsequent arrest.
Regional features may also stem from the actions of the administrative resource, which can manifest itself in different ways, depending on the type of election—following a change of governor or for other reasons. That said, if United Russia lost 2–10% in 2021 compared to 2016 in most regions, then it gained 12.8% in Ingushetia, 11.4% in Jewish Autonomous Oblast and 10.2% in Bashkortostan. On the contrary, in Kalmykia and Mordovia the party lost 31.1% and 18.4% respectively. As a result, different regions may form different voting patterns.
In this respect, vote overflow assessments will only be qualitative, even if quantitative methods are used. For this reason, we did not use complex methods, where the reliability of the results is difficult to assess. Instead, we limited ourselves to correlation and regression analysis, which paint a clear picture.
In all cases, we examined the correlation and regression relationships between the 2021 and 2016 result differences. For the three new parties, these differences were equal to their 2021 result. For the three parties that did not run in the 2021 election, these differences were equal to their 2016 result, taken as a negative number. Our primary concern involved negative correlations, which could indicate instances of vote overflow in this context.
Various data sets of vote returns can be used for the purposes of statistical analysis. That said, one can technically use the data on the number of votes for parties. Another option is to use shares of votes from the number of listed voters. A third option is to use shares of votes from the number of actual voters (which usually appear in officially released documents as well).
We consider absolute numbers of votes a poor choice, because in this case, differences in the number of voters in different territories and differences in turnout create false correlations. For this reason, we have to concern ourselves with relative indicators.
The choice of shares of votes from the voter list seems more preferable. In this case, we can separately calculate the proportion of non-voters and try to assess the overflow from non-voters to parties as well as the overflow between parties alone. In the case of the shares of the number of actual voters, we actually ignore the differences in turnout (which is 3.8% between the 2021 and 2016 elections for Russia as a whole) and those voters who were non-voters in the previous elections.
However, a test analysis on the data sets for 225 CoECs showed that the choice of shares of votes from the number of actual voters indicated higher correlations in almost all pairs than the choice of shares of votes from the voter list. This way, the correlation coefficient for the New People/LDPR pair was -0.522 in the first case and -0.346 in the second. For the CPRF/United Russia pair, the first correlation amounted to -0.581, while the second amounted to 0.075. At the same time, the difference in the share of non-voters had a significant negative correlation with the gains of parties that increased their results (CPRF, A Just Russia, Party of Pensioners) and with the results of the two new parties (RPSS and Green Alternative), but not a particularly high one (from ‑0.315 to -0.365).
It is likely that the weak correlations in the calculations based on vote shares from the voter list have something to do with the changes in the electorate discussed earlier. With that said, this study further relies on the vote shares from the number of actual voters.
The next issue: available data arrays on vote returns broken down by regions (89), by CoECs (225) and by TECs. In the very last option, we had to leave out mergers or split-ups of TEC that occurred between 2016 and 2021 (in particular, we had to leave out all of the Saint Petersburg TECs), as well as those 15 Moscow TECs that had remote e-voting polling stations assigned to them. A total of 2738 TECs were included in the data array.
The comparison showed that the values of correlation coefficients on different data arrays are close in most cases. For example, the correlation coefficient for the New People/LDPR pair equaled -0.598 on the regional array, -0.522 on the CoEC array, and -0.440 on the TEC array. For the CPRF/United Russia pair, the correlation on the regional array equaled -0.559, ‑0.581 on the CoEC array, and ‑0.617 on the TEC array. For the Green Alternative/Yabloko pair, the regional array yielded a correlation of -0.451, the CoEC and TEC arrays yielded -0.734 and -0.481 respectively.
After analyzing this data, we decided to use the CoEC array for calculations. First, when it comes to the number of voters, CoEC division is more level than regional or TEC division. Second, the CoEC array contains more rows than the regional array, so the rows have greater significance when the coefficients are equal. At the same time, the CoEC array covers all data, unlike the TEC array. Third, the CoEC array coefficients are either larger in absolute value than on the other arrays, or not much smaller. At the same time, we used the TEC arrays for regional calculations.
Correlation Analysis
The results of the correlation analysis for the whole country across the CoECs are shown in Table 1. The rows correspond to the parties that did not participate in the 2021 elections and the parties that lost votes in 2021; the columns correspond to the new parties and the parties that gained votes in 2021.
Table 1. Correlation coefficients between party result differences in the 2021 and 2016 State Duma elections across CoECs in Russia
| Party | New People | RPSS | GA | CPRF | JR | Pension. | REPG |
| United Russia | -0.372** | -0.120 | -0.107 | -0.581** | -0.302** | -0.498** | -0.190* |
| LDPR | -0.522** | -0.185* | -0.222** | -0.347** | -0.117 | -0.168* | 0.089 |
| Yabloko | -0.259** | -0.645** | -0.734** | -0.246** | -0.053 | 0.191 | -0.169* |
| Party of Growth | -0.408** | -0.521** | -0.608** | -0.208* | -0.138* | 0.053 | -0.009 |
| Communists of Russia | -0.036 | 0.165 | 0.178 | -0.042 | 0.097 | 0.032 | 0.059 |
| Rodina | -0.291** | -0.505** | -0.515** | -0.206* | -0.124 | 0.101 | -0.151* |
| Civic Platform | -0.333** | -0.089 | -0.146* | -0.234** | 0.137 | -0.107 | -0.076 |
| Patriots of Russia | -0.125 | 0.013 | -0.109 | -0.028 | -0.073 | -0.077 | -0.495** |
| PARNAS | -0.435** | -0.790** | -0.859** | -0.291** | -0.118 | 0.155 | -0.119 |
| Civilian Power | -0.268** | -0.493** | -0.551** | -0.245** | 0.047 | 0.115 | 0.012 |
Abbreviations: GA — Green Alternative; Pension. — Russian Party of Pensioners for (Social) Justice; RPSS — Russian Party of Freedom and Justice; REPG — REP The Greens; AJR — A Just Russia.
* – p < 0.05; ** – p < 0.001 (for negative correlations).
As we can observe from the table, the three new parties and CPRF indicate significant correlations with most parties featured in the rows. On the other hand, A Just Russia, Russian Pensioners Party and REP The Greens have few significant correlations. Out of the parties featured in the rows, United Russia, LDPR, Yabloko, Party of Growth and Rodina have the largest number of significant correlations. PARNAS and Civilian Power have fewer, and Civic Platform has even less than the former two. The only significant correlation Patriots of Russia has is with REP The Greens (Krasnoyarsk Krai may have been the main contributing factor [18]), while Communists of Russia have no significant negative correlations whatsoever.
The following pairs displayed the highest absolute values of correlation coefficients (over 0.5): Green Alternative / PARNAS, RPSS / PARNAS, Green Alternative / Yabloko, RPSS / Yabloko, Green Alternative / Party of Growth, CPRF / United Russia, Green Alternative / Civilian Power, New People / LDPR, RPSS / Party of Growth, Green Alternative / Rodina, RPSS / Rodina.
Next, for analytical purposes, we picked 12 regions with a large number of TECs (at least 45) that were not part of the group of regions with electoral anomalies. For these regions, we calculated correlation coefficients across TEC for the seven most intriguing pairs (see Table 2).
Table 2. Correlation coefficients between party result differences in the 2021 and 2016 State Duma elections across TECs
| Region | CPRF / UR | CPRF / LDPR | NP / LDPR | RPSS / Rodina | GA / Yabloko | GA / PoG | GA / PARNAS |
| Altai Krai | -0.347* | -0.462** | -0.288* | -0.338* | -0.588** | -0.764** | -0.714** |
| Perm Krai | -0.157 | -0.458** | -0.027 | -0.288* | -0.610** | -0.753** | -0.815** |
| Irkutsk Oblast | -0.775** | -0.187 | -0.366* | -0.199 | 0.006 | -0.180 | -0.407* |
| Kirov Oblast | -0.243 | 0.064 | -0.147 | -0.228 | -0.552** | -0.591** | -0.587** |
| Moscow Oblast | -0.869** | 0.272 | 0.126 | -0.035 | -0.232 | -0.498** | -0.599** |
| Nizhny Novgorod Oblast | -0.848** | -0.022 | -0.194 | -0.445** | -0.560** | -0.729** | -0.623** |
| Novosibirsk Oblast | -0.565** | -0.196 | 0.440 | -0.353* | -0.798** | -0.700** | -0.839** |
| Samara Oblast | -0.839** | 0.186 | -0.164 | -0.562** | -0.838** | -0.432* | -0.887** |
| Sverdlov Oblast | -0.110 | -0.242* | 0.155 | -0.320* | -0.286* | -0.596** | -0.750** |
| Tver Oblast | -0.679** | -0.467* | -0.479** | 0.316 | -0.539** | -0.671** | -0.786** |
| Chelyabinsk Oblast | -0.685** | 0.288 | -0.177 | -0.209 | -0.837** | -0.635** | -0.917** |
| Moscow | -0.613** | -0.191* | 0.337 | -0.259* | -0.098 | -0.298* | -0.330** |
Abbreviations: UR — United Russia; GA — Green Alternative; NP — New People; PoG — Party of Growth; RPSS — Russian Party of Freedom and Justice.
* – p < 0.05; ** – p < 0.001 (for negative correlations).
The table shows that the Green Alternative / PARNAS pair yields significant correlations in all of the regions studied, and Irkutsk Oblast is the only one to display the significance below 0.1%. The Green Alternative / Party of Growth pair yielded significant correlations in 11 regions, Green Alternative / Yabloko — in 10, CPRF / United Russia — in 9, RPSS / Rodina — in 7. The CPRF / LDPR and New People / LDPR pairs only yielded significant correlations in 5 and 3 regions respectively.
Regression Analysis for the Whole of Russia
The correlation coefficients show how reliable the relationship is between vote losses of some parties and vote gains for others. However, they do not say anything about the scale of vote overflows. Regression analysis data is required to estimate the overflow.
As Table 1 shows, the best correlation is between voting for PARNAS in 2016 and voting for Green Alternative in 2021. Figure 1 shows that the relationship between these variables lies almost perfectly on the regression line, which crosses the y-axis close to the origin (free term 0.24%) and has a slope of 0.53. But if we forcibly set the regression line to start at the origin, the slope coefficient will rise to 0.71. However, the graph shows several points that deviate markedly from the regression line and appear to cause distortions.
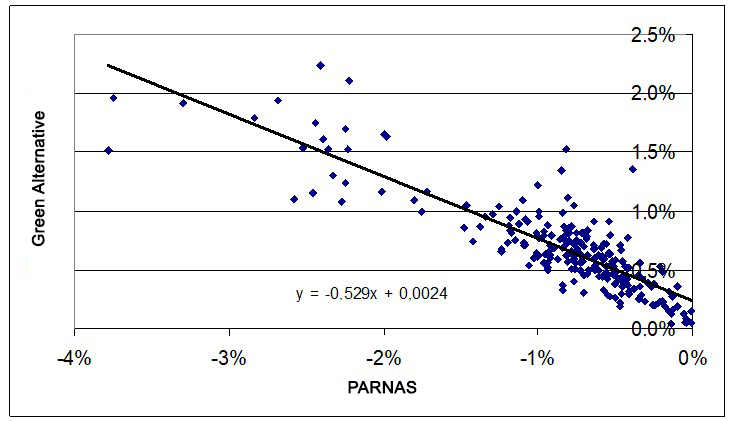
Figure 1. Dependence of the 2021 vote share for Green Alternative on the 2016 vote share (taken as a negative) for PARNAS. The points indicate the CoECs.
Such deviations are more visible on the graphs for the Green Alternative / Yabloko pair (Fig. 2) and the RPSS / PARNAS pair (Fig. 3). There are even greater deviations in the New People / LDPR pair (Fig. 4) and in the New People / Yabloko, New People / PARNAS, New People / Party of Growth, RPSS / Rodina, and CPRF / LDPR pairs not shown in the figures.
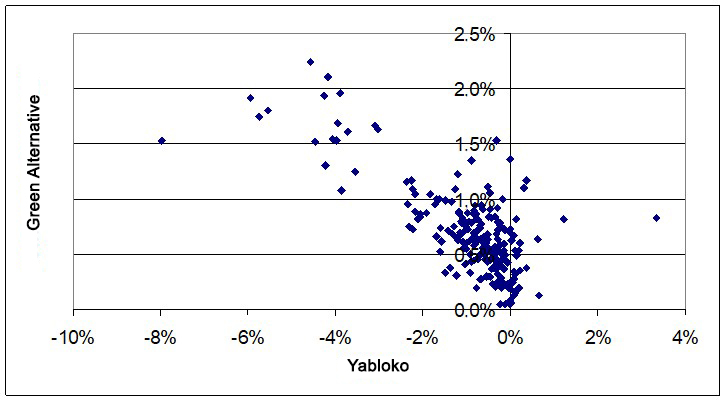
Figure 2. Dependence of the 2021 vote share for Green Alternative on the vote share difference for Yabloko in 2021 and 2016. The points indicate the CoECs.
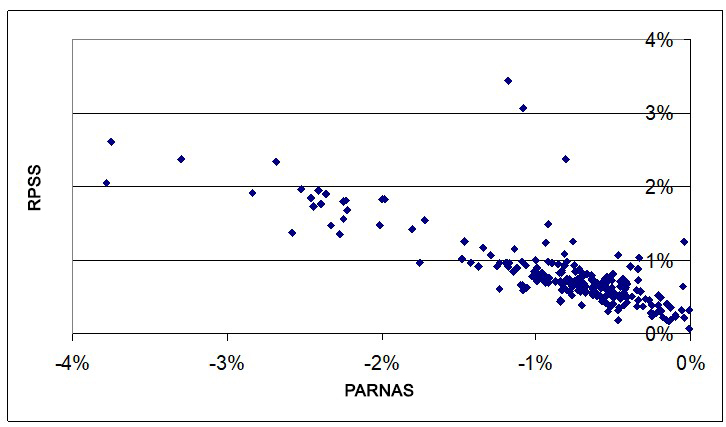
Figure 3. Dependence of the 2021 vote share for RPSS on the 2016 vote share (taken as a negative) for PARNAS. The points indicate the CoECs.

Figure 4. Dependence of the 2021 vote share for New People on the vote share difference for LDPR in 2021 and 2016. The points indicate the CoECs.
The graph of the correlation between the vote gain for CPRF and the vote loss for United Russia turned out quite descriptive as well (Fig. 5). In this case, the regression line passes noticeably higher than the origin of coordinates and crosses the y-axis at 4.6%. The slope is - 0.39. At the same time, we can observe a number of highly divergent points.
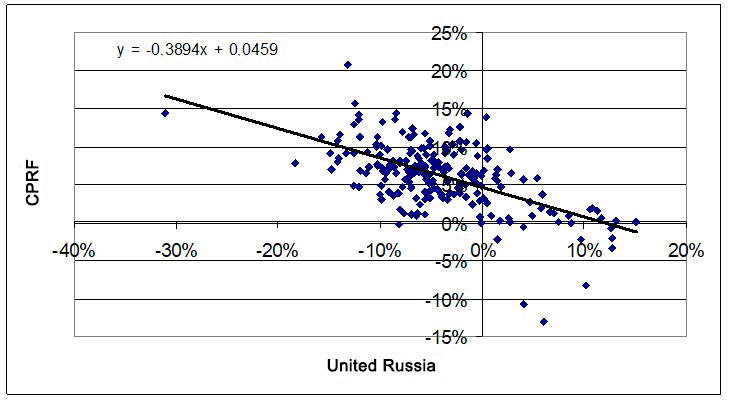
Figure 5. The dependence of the 2021 CPRF vote gain as compared to 2016 on the vote share difference for United Russia in 2021 and 2016. The points indicate the CoECs.
Overall, the results of the correlation and regression analyses provide the following information on vote overflow. United Russia's vote losses primarily come from voting for CPRF and less so from voting for New People. Vote overflow from United Russia to CPRF can be estimated at 39% of United Russia's vote loss (since the slope coefficient is modulo 39%), which is 1.7% of the number of actual voters, or about one million votes. The vote overflow from United Russia to New People can be roughly estimated at 15% of the United Russia vote loss, which is 0.6% of the number of actual voters, or about 400 thousand votes.
New People received a noticeably larger vote share at the expense of LDPR — about 37% of those losses, or roughly 2% of the actual voters, or about 1.2 million votes. At the same time, New People got votes from Yabloko, Party of Growth, PARNAS and Rodina (and, to a lesser extent, from Civic Platform and Civilian Power). Votes of these same parties also went over to both RPSS and Green Alternative.
It is somewhat more difficult to assess the vote overflow in this case, since there is a tangible positive correlation (0.788) between RPSS and Green Alternative, as well as a solid positive correlation between PARNAS vote gain and vote losses of Yabloko, Party of Growth and Rodina (for example, 0.817 in the PARNAS / Yabloko pair). The general pattern of vote overflow is illustrated in Figure 6, which shows the dependence of the net result of RPSS and Green Alternative on the net result of PARNAS and Civilian Power as well as vote losses of Yabloko, Party of Growth, Rodina and Civic Platform.
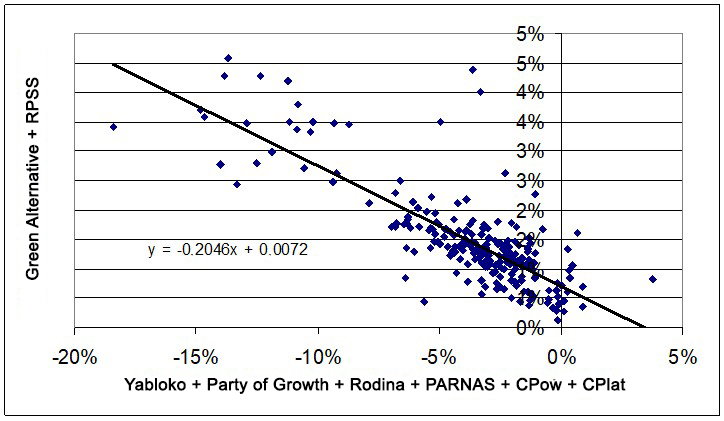
Figure 6. The dependence of the net vote share for Green Alternative and RPSS in 2021 on the net vote share for PARNAS and Civilian Power in 2016 as well as the difference between vote shares for Yabloko, Party of Growth, Rodina, and Civic Platform in 2021 and 2016. The points indicate the CoECs.
In this case, we tried multiple regression. For RPSS and Green Alternative, this method yielded satisfactory overflow assessments. Table 3 shows regression coefficients for these two dependence cases.
Table 3. Multiple regression coefficients for the dependence of vote shares for RPSS and Green Alternative on vote losses of six parties (across CoECs)
| Party | RPSS | Green Alternative |
| Yabloko | -0.385 | -0.303 |
| Party of Growth | -0.651 | -0.484 |
| Civic Platform | -0.038 | -0.003 |
| Rodina | 0.031 | -0.124 |
| PARNAS | 0.060 | 0.018 |
| Civilian Power | 0.015 | -0.027 |
| Constant term | 0.002 | 0.002 |
These results indicate that Yabloko and Party of Growth are the main contributors to the vote overflow to both parties. From Yabloko, RPSS and Green Alternative got about 0.25% and 0.20% of votes (of the numbers of actual voters) respectively. From Party of Growth, RPSS and Green Alternative got about 0.52% and 0.39% of votes respectively. There is also a small overflow of votes from Rodina to Green Alternative (0.09%). Assessing vote overflow for the rest of the parties using this data proves to be difficult.
For New People, multiple regression does not produce satisfactory results. Simple regression seems to be the only method to assess the total vote overflow from six parties at about 0.9% (about 500,000 votes) of the number of actual voters. We ought to point out that the sum of our assessments concerning vote overflow to New People from LDPR, United Russia and the six "minor" parties comes to about 3.5% of the votes, that is, about two-thirds of their result (in total, the New People received 5.3% of the vote).
Regression and Correlation Analysis for Constituency Groups
The graphs above display a number of divergent points. Analysis showed that such points correspond to different constituencies and regions for different parties. This has to do with the regional characteristics of voting for certain parties in 2016 and/or 2021. For example, in Moscow and Saint Petersburg (and, to a lesser extent, in Moscow Oblast), support for liberal parties (Yabloko, Party of Growth, PARNAS) was high in 2016. In 2021, Yabloko and Party of Growth displayed the greatest losses (4.1%, 2.2%, 1.8% for Yabloko in Moscow, Saint Petersburg and Moscow Oblast respectively; and 2.4%, 4.9%, 1.3% for Party of Growth in Moscow, Saint Petersburg and Moscow Oblast respectively). Arkhangelsk Oblast produced an opposite example, when Oleg Mandrykin, a leading figure in environmental protest movement who ran as a Yabloko candidate, brought the party a boost in votes. Tambov Oblast was the only region that produced an increase in votes for Rodina. There are other regions that deviated from the overall pattern (some republics, Stavropol Krai, Tyumen Oblast, Jewish Autonomous Oblast).
For this reason, we attempted to make calculations for certain areas. First, we removed 25 constituencies with deviating results: no. 2 (Altai Republic), 3, 4, 6, 8 (Republic of Bashkortostan), 10–12 (Republic of Dagestan), 13 (Republic of Ingushetia), 14 (Kabardino-Balkarian Republic), 15 (Republic of Kalmykia), 16 (Karachay-Cherkess Republic), 23 (Republic of Mordovia), 29 (Republic of Tatarstan), 52 (Krasnodar Krai), 65–67 (Stavropol Krai), 72, 73 (Arkhangelsk Oblast), 177, 178 (Tambov Oblast), 185, 186 (Tyumen Oblast) и 220 (Jewish Autonomous Oblast).
Second, we separated Moscow, Saint Petersburg and Moscow Oblast (34 constituencies) from the rest of the Russian Federation (166 constituencies). Further on, we will respectively refer to the first and the second group as "metropolitan" and "peripheral". Table 4 shows a comparison of correlation coefficients with the results of New People.
Table 4. Correlation coefficients between the 2021 New People result and the difference between the results of other parties in the 2021 and 2016 State Duma elections across Russia and constituency groups broken down by CoECs
| Party | Russia | Peripheral group | Metropolitan group |
| LDPR | -0.522** | -0.627** | 0.486 |
| Yabloko | -0.259** | -0.463** | -0.245 |
| Party of Growth | -0.408** | -0.489** | -0.604** |
| Civic Platform | -0.333** | -0.375** | -0.128 |
| Rodina | -0.291** | -0.422** | -0.130 |
| PARNAS | -0.435** | -0.677** | -0.484* |
| Civilian Power | -0.268** | -0.317** | -0.660** |
* – p < 0.05; ** – p < 0.001 (for negative correlations).
As is evident from the table, New People retains and mostly intensifies correlations with LDPR, Rodina and the liberal parties in the peripheral group. This is evident in the graphs as well. Fig. 7 shows the dependence of vote shares for New People on the difference in the vote shares for LDPR. The dependence has a slope of -0.45 and crosses the y-axis close to the 3% point.
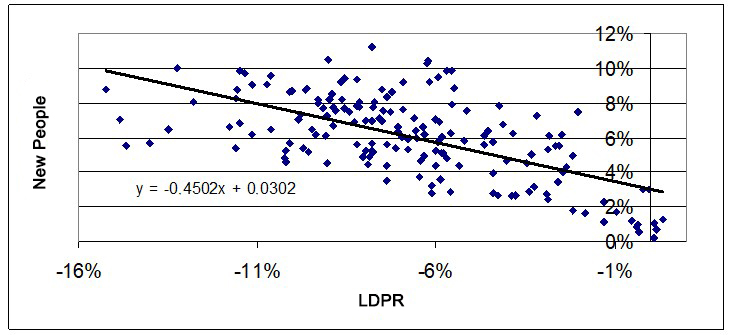
Figure 7. Dependence of the 2021 vote share for New People on the vote share difference for LDPR in 2021 and 2016. The points indicate the 166 CoECs.
Fig. 8 shows the dependence of vote shares for New People on the sum total difference between the vote shares for the six "minor" parties. The dependence crosses the y-axis close to the 3% point as well. Its slope is slightly greater than modulo one, which makes no physical sense, since the slope should reflect the share of votes for the respective parties that went to New People. Given the impreciseness of this data, we can assume that the overflow share is close to one.
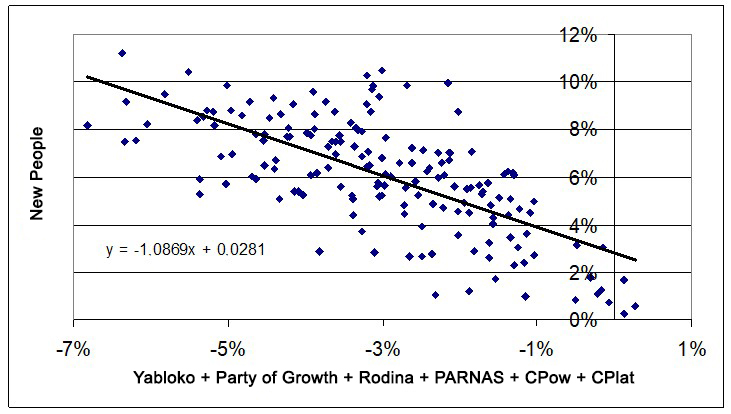
Figure 8. The dependence of the vote share for New People in 2021 on the net vote share for PARNAS and Civilian Power in 2016 as well as the difference between vote shares for Yabloko, Party of Growth, Rodina, and Civic Platform in 2021 and 2016. The points indicate the 166 CoECs.
An attempt to estimate the vote overflow on the data array of 166 CoECs by multiple regression for all seven parties at once did not yield satisfactory results (several parties yielded coefficients markedly greater than 1). However, when we reduced the number of independent variables to two (LDPR and the sum of the six "minor" parties), the coefficient amounted to -0.805 and -0.289 (free term 0.017) for LDPR and the sum or the parties respectively. Unfortunately, these coefficients are very different from those obtained by simple regression above. Nevertheless, all the evidence confirms that there is a vote overflow to New People from LDPR and a number of "minor" parties.
The metropolitan group of constituencies paints a different picture. In this case, there is a positive correlation between the New People result and the difference between the LDPR results (see Table 4), which does not allow us to make the case about the vote overflow from LDPR to New People. The overflow from "minor" parties to New People, however, is quite measurable (Table 4 shows significant correlations between Party of Growth, PARNAS, and Civilian Power). However, the slope of the regression line is quite small, amounting to only -0.2 (see Fig. 9), while that of the free term is quite large (4.5%) by contrast. The point corresponding to Novomoskovsk Constituency no. 202 indicates a significant deviation. There, Smart Voting-endorsed Danil P. Makhnitsky ran in the single-seat constituency as a New People candidate — his participation created the "contamination effect" and had a measurable impact on the party's result (10.4%). This deviation, however, did not produce any significant impact on the regression parameters.
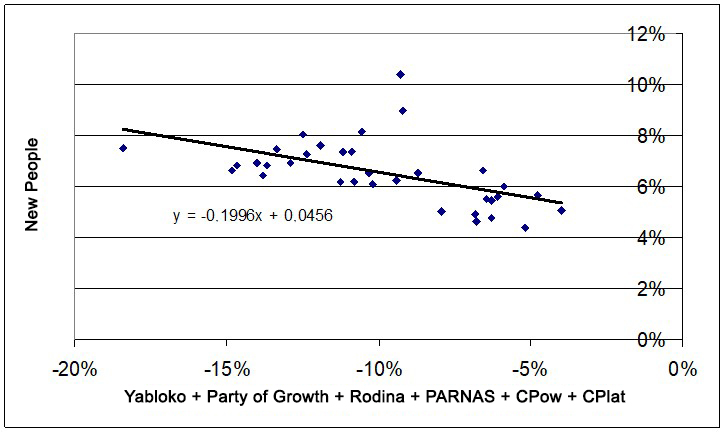
Figure 9. The dependence of the vote share for New People in 2021 on the net vote share for PARNAS and Civilian Power in 2016 as well as the difference between vote shares for Yabloko, Party of Growth, Rodina, and Civic Platform in 2021 and 2016. The points indicate 34 CoECs in Moscow, Moscow Oblast and Saint Petersburg.
At the same time, there is a sizeable correlation between the CPRF's vote gain and the vote losses of "minor" parties in this group. Yabloko displayed the highest correlation coefficient (-0.546), as did PARNAS (-0.412) and Civilian Power (-0.348). Rodina's correlation coefficient verges on significance at -0.338. Fig. 10 shows the dependence of CPRF's vote gain on the losses of "minor" parties. The fact that this dependence occurs in the metropolitan group seems to originate from the Smart Voting strategy, which made a particularly significant in this case [15: 70].
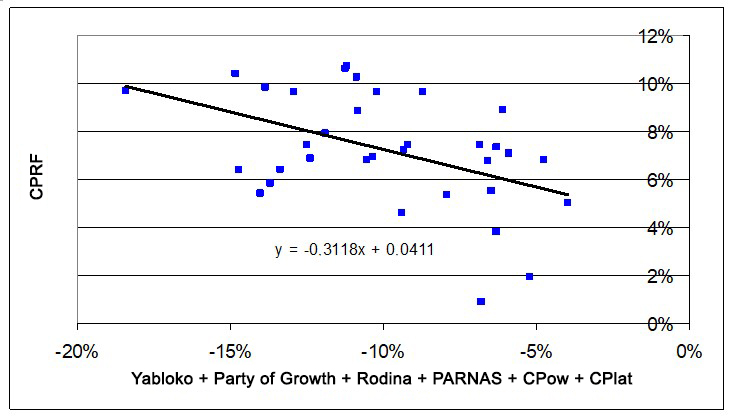
Figure 10. The dependence of the CRPF vote gain in 2021 vs. 2016 on the net vote share for PARNAS and Civilian Power in 2016 as well as the difference between vote shares for Yabloko, Party of Growth, Rodina, and Civic Platform in 2021 and 2016. The points indicate 34 CoECs in Moscow, Moscow Oblast and Saint Petersburg.
The peripheral group also displays a negative correlation between the CPRF and LDPR differences, which indicates vote overflow between these parties. The correlation coefficient for the group amounted to -0.381, the slope of the regression line amounted to -0.454, and the free term of the regression equation amounted to 0.036. At the same time, the graph (not shown) shows many more divergent points. For the metropolitan group, the correlation between the CPRF and LDPR differences is positive.
Discussion
One of the main tasks of electoral sociology is to understand how the will of the voter is shaped. There is a number of competing theories that try to explain the electoral behavior of voters; these studies are mostly based on studying the elections and electorate in the US and Western Europe [6: 223–253; 17: 9–53]. If it is unclear how exactly these theories apply to mature democratic countries, it is especially unclear if they are able to explain electoral behavior of voters in Russia [16: 550-572].
Since for about two decades elections in Russia have been dominated by United Russia — the party with close ties to the executive branch — the voter's main choice is whether to vote for this party or for any other that is considered opposition (at least nominally). This was most clearly manifested in the 2011 State Duma election (the "Vote for Any Other Party" campaign), but similar motives persisted throughout subsequent campaigns as well.
At the same time, United Russia's results in federal elections have remained relatively stable over the last three campaigns. In 2003 the party's result amounted to 37.6%, rising to 64.3% in 2007. Then there was a noticeable drop in 2016 (54.2%), and in 2011 and 2021, it experienced another slight drop, but stayed about the same (49.3% and 49.8%, respectively). Here, we can make a caveat that all these numbers reflect not only the mere will of the voters, but also the contribution of the administrative resource. However, this caveat barely changes anything.
Those voters who prefer to vote for the opposition and who constitute about a half (if one believes the official statistics) of the electorate have to choose which opposition party to vote for. This is where the change of voter preference over the last three campaigns was more evident: 13.3% in 2016 to 19.2% in 2011 and 18.9% in 2021 for CPRF; 13.1% in 2016 to 7.5% in 2021 for LDPR; 13.2% in 2011 to 6.2% in 2016 for A Just Russia; and New People that was founded in 2021 with 5.3%.
Voters' choice between these parties (as well as the less influential "minor" parties) may in part be induced by ideological motives, but this factor can hardly explain the fluctuations in their level of support that was described above. Apparently, the main motive for vote overflow between these parties is the perception of which party is the most oppositional at a given moment. As for vote overflow from "minor" to parliamentary parties, it was, among other things, spurred by tactical voting, which is based on the notion that votes for parties that did not get over the threshold would be lost or, according to certain propagandists, would "fall to" United Russia [8; 15].
In this regard, the problem of vote overflow from one party to another and overflow scale assessments are clearly not without interest.
The results of our study show the following patterns of vote overflow from parties in the 2016 State Duma elections to parties in the 2021 State Duma elections were most common in the regions:
· from United Russia to CPRF;
· from United Russia to New People;
· from LDPR to New People;
· from LDPR to CPRF;
· from "minor" parties (Yabloko, Party of Growth, PARNAS, Rodina, Civic Platform, Civilian Power) to New People, RPSS and Green Alternative.
Moscow, Moscow Oblast and Saint-Petersburg indicated no vote overflow from LDPR to New People and CPRF, although there is a clear overflow from liberal parties to CPRF.
Certain regions may display their unique vote overflow patterns. For example, Konstantin Zhuribeda's piece [18] on Krasnoyarsk Krai showed an instance of vote overflow from Patriots of Russia (which achieved notable results in the region in 2016) to REP The Greens, New People and LDPR.
The overall data on vote overflow confirms our previous conclusion that was based on rank distribution analysis [10: 547-548; 12: 101] — the conclusion that parties compete on different fields: leading, middling and outsider parties all have their respective ones. In this case, the leading parties include United Russia, CPRF, and LDPR; the middling parties include A Just Russia and New People (and, to a lesser extent, Party of Pensioners); all of the remaining parties are outsiders. However, when it comes to Moscow and Saint Petersburg, Yabloko and Party of Growth can also be considered middling parties (especially in 2016). In Krasnoyarsk Krai, the middling group included Patriots of Russia in 2016 and REP The Greens In 2021.
In our recent paper [9], we used correlation and regression analyses to assess who New People voters voted for in the 2021 regional elections when the party was not on the regional ballot. We came to a conclusion that they voted for different parties, almost all the parties represented on the regional ballot. Nevertheless, it turned out that voting for A Just Russia and the Russian Pensioners Party was the preference of a significant part of New People voters. That instance was about vote overflow between elections held simultaneously at different levels instead of that between elections of different years. However, the overflow occurred within the middling parties group in this case as well.
There is a whole separate issue of whether the results of such analysis are satisfactory enough when the official vote returns are distorted as a result of election fraud. We have already discussed this issue in previous papers [10: 422–425; 12: 302–303]. Given the low accuracy of the results described above, we can say that election fraud practices do not have much of an effect. There are several reasons for that.
First, the results of all opposition parties are low in the regions where the level of fraud is high. The differences between the results of different years are low as well, so election fraud does not distort the results of correlation and regression analysis to any significant extent. However, it is evident that when analysis excludes constituencies with anomalies (which are not linked with fraud alone, but also with actual electoral behavior features), the correlation indicators improve.
Second, ballot box stuffing and the like are the most dominant cases of fraud in Russian elections, and such case can indeed affect the assessment of vote overflow from United Russia to other parties. The results of the opposition parties are less distorted relative to each other, so vote overflow between them can be assessed more reliably.
In general, we believe that correlation and regression analysшs are quite suitable for a qualitative assessment of vote overflow. Whether a precise quantitative assessment is possible altogether is still difficult to say.
The author would like to thank Sergei Shpilkin and Andrei Buzin for their help in obtaining data on vote returns in the 2021 election.
Received 15.02.2022, revision received 18.03.2022.
References
- Bolshakov I.V., Perevalov V.V. Assessing the Effectiveness of "Smart Voting" Strategy: A Discussion of Analytical Approaches. – Electoral Politics. 2020. No. 1 (3). P. 6. - http://electoralpolitics.org/en/articles/otsenka-effektivnosti-umnogo-golosovaniia-spor-analiticheskikh-podkhodov/
- Bolshakov I.V., Perevalov V.V. Konsolidatsiya ili protest? "Umnoye golosovaniye" na moskovskikh vyborakh [Consolidation or protest? "Smart Voting" in Moscow election]. – Politeia. 2020. No. 1 (96). P. 50–73. DOI: 10.30570/2078-5089-2020-96-1-50-73. (In Russ.)
- Buzin A.Yu. Someone else's victory. – Electoral Politics. 2020. No. 1 (3). P. 5. - http://electoralpolitics.org/en/articles/chuzhaia-pobeda/
- Demografiya. Rozhdayemost, smertnost i yestestvenny prirost naseleniya [Demography. Birth Rate, Death Rate and Natural Population Growth]. – Federal State Statistics Service website. URL: https://rosstat.gov.ru/storage/mediabank/uZ1ct28L/demo21.xls (accessed 15.02.2022). (In Russ.) - https://rosstat.gov.ru/storage/mediabank/uZ1ct28L/demo21.xls
- Elektoralny landshaft Rossii. Materialy kruglogo stola [Russia’s Electoral Landscape. Round Table Discussion Proceedings]. Moscow: Open Economy Institute, 2005. 38 p. URL: http://openecon.shulgin.ru/attach.asp@a_no=504 (accessed 15.02.2022). (In Russ.) - http://openecon.shulgin.ru/attach.asp@a_no=504
- Golosov G.V. Sravnitelnaya politologiya: Uchebnik [Comparative political science: a textbook]. Saint-Petersburg: Izd-vo Evrop. un-ta. 2001. 368 p. (In Russ.)
- Kunov A., Myagkov M., Sitnikov A., Shakin D. Rossiya i Ukraina: neregulyarnyye resultaty regulyarnykh vyborov: Analitichesky doklad [Russia and Ukraine: Irregular Results of Regular Elections: An Analytical Report]. Moscow: Open Economy Institute, 2005. 37 p. URL: http://openecon.shulgin.ru/attach.asp@a_no=521 (accessed 15.02.2022). (In Russ.) - http://openecon.shulgin.ru/attach.asp@a_no=521
- Kynev A.V. Obshchiye itogi vyborov i izbiratelnoi kampanii–2021 [A Broad Assessment of the 2021 Election and Electoral Campaign]. – Liberal Mission Foundation website, 6 December 2021. URL: https://liberal.ru/reports/obshhie-itogi-elektoralnyh-rezultatov-izbiratelnoj-kampanii-2021?download=32099 (accessed 15.02.2022). (In Russ.) - https://liberal.ru/reports/obshhie-itogi-elektoralnyh-rezultatov-izbiratelnoj-kampanii-2021?download=32099
- Lyubarev A.E. Issledovaniye sovmeshchennykh vyborov: za kogo golosovali izbirateli “Novykh lyudei” pri otsutstvii partii v byulletene [A Study of Combined Election: Who New People Voters Voter For When the Party Was Not on the Ballot]. – Vestnik Permskogo Universiteta. Politologiya [Perm University Herald. Political Science]. 2022. No. 1. P. 125–135. DOI: 10.17072/2218-1067-2022-1-125-135 (In Russ.)
- Lyubarev A.E. Izbiratelnyye sistemy: rossiisky i mirovoi opyt [Electoral Systems in Russia and Across the World]. Moscow: ROO “Liberalnaya missiya”; Novoye literaturnoye obozreniye, 2016. 632 p. (In Russ.)
- Lyubarev A.E. "Smart Voting" as One of the Determining Factors in the 2019 Moscow City Duma Election Results. – Electoral Politics. 2020. No. 1 (3). P. 7. - http://electoralpolitics.org/en/articles/umnoe-golosovanie-kak-odin-iz-faktorov-povliiavshikh-na-rezultaty-vyborov-v-moskovskuiu-gorodskuiu-dumu-2019-goda/
- Lyubarev A.E. Zanimatelnaya elektoralnaya statistika [Entertaining Election Statistics]. Moscow: Golos Consulting, 2021. 304 p. (In Russ.)
- Myagkov M., Ordeshook P.C., Shakin D. The Forensics of Election Fraud: Russia and Ukraine. N.Y.: Cambridge University Press, 2009. 289 p.
- Myagkov M., Sitnikov A., Shakin D. Elektoralny landshaft Rossii. Analitichesky doklad [Russia’s Electoral Landscape. An Analytical Report]. Moscow: Open Economy Institute, 2004. 41 p. URL: http://openecon.shulgin.ru/attach.asp@a_no=503 (accessed 15.02.2022). (In Russ.) - http://openecon.shulgin.ru/attach.asp@a_no=503
- Novaya realnost: Kreml i Golem. Chto govoryat itogi vyborov o sotsialno-politicheskoi situatsii v Rossii [A New Reality: Kremlin and Golem. What Election Results Say About the Social and Political Situation in Russia] / Ed. by K. Rogov. Moscow: Liberal Mission, 2021. 113 p. (In Russ.)
- Politicheskaya sotsiologiya: uchebnik [A Textbook of Political Sociology] / Ed. by Zh.T.Toshchenko. – Moscow: Yurait. 2012. 624 p. (In Russ.)
- The Routledge Handbook of Elections, Voting Behavior and Public Opinion / eds J.Fisher, E.Fieldhouse, M.N.Franklin, R.Gibson, M.Cantijoch and C.Wlezien. L. and N.Y.: Routledge. 2018. 550 p.
- Zhuribeda K.O. Krasnoyarsk Krai Electoral Characteristics Based on the 2016 and 2021 State Duma Elections Results. – Electoral Politics. 2021. No. 2 (6). P. 2. - http://electoralpolitics.org/en/articles/elektoralnye-kharakteristiki-krasnoiarskogo-kraia-po-itogam-vyborov-deputatov-gosudarstvennoi-dumy-v-2016-i-2021-godakh/