 Konstantin O. Zhuribeda
Political analyst, [email protected]
Krasnoyarsk Krai Electoral Characteristics Based on the 2016 and 2021 State Duma Elections Results
Abstract
The article provides a comparison of the main electoral characteristics of Krasnoyarsk Krai—one of Russia's largest regions—in the 2016 and 2021 State Duma elections. Using electoral statistics, the author compares voter turnout, voting outside the polling station and voting for election participants. A comparison of the two elections allows us to draw conclusions about the electoral dynamics in the region. Moreover, correlation and regression analyses are used to analyze the transitions of electoral bases of political parties between the two elections.
The study of electoral processes in the Russian Federation attracts increased attention in different academic fields: political science, geography, sociology. The dynamics of ideological and political attitudes of the Russian population is one of the central issues of the country's political development.
Krasnoyarsk Krai is one of Russia's largest regions, both economically and politically. Such things as the krai's large territory (stretching from the Arctic Ocean to the Sayan Mountains), social and economic differences between its districts, employment patterns, climate and political culture suggest that electoral campaigning in the region is as varied as the region itself.
This article analyzes Krasnoyarsk Krai's main electoral characteristics in the 2016 and 2021 State Duma elections. There are several reasons for choosing these elections for study. First, they share a legislative basis (Federal Law of 22 February 2014 "On Elections of Deputies to the State Duma of the Federal Assembly of the Russian Federation"). Second, both elections were held under a mixed electoral system. Third, they share a geographical space (the number of territorial electoral commissions in the region did not change). And fourth, the list of election participants mostly stayed the same (14 parties in both campaigns), which will allow to draw conclusions about the electoral dynamics of parties in the region.
The choice of Krasnoyarsk Krai as a territory for electoral space study is not a random one. The region has long-standing democratic traditions; elections of different level (gubernatorial and parliamentary) are traditionally highly competitive. As a result of the 2021 election, six parties were elected to the regional legislative assembly: besides the five federal parties (United Russia, the CPRF, the LDPR, A Just Russia – For Truth, New People), REP The Greens also gained seats [3]. The municipal level is characterized by pluralism as well, due to the use of a mixed electoral system in the region's cities and districts, which makes it possible for different parties to gain representation.
The raw data for the study are taken from the protocols of precinct and territorial election commissions (PECs and TECs). The data includes the primary electoral characteristics: the number of voters, the number of valid and invalid ballots, the composition and number of votes for election participants [1].
The geographical sample required for analyzing the electoral space of Krasnoyarsk Krai includes the current municipal entities of the region. In 2016 and 2021, 70 TECs were formed in the region. They correspond to the districts of the regional capital Krasnoyarsk, municipalities and municipal raions (Rus. for "districts"). Two TECs were formed in the territory of the Taimyrsky (Dolgano-Nenetsky) District and three (Baikitskaya, Ilimpiyskaya and Tungusso-Chunskaya) were formed in Evenkiysky District. Moreover, the territorial commissions of Beryozovsky and Yemelyanovsky districts formed two final protocols each, which is a consequence of dividing territories of these districts between single-seat constituencies. Therefore, we have 72 final TEC protocols for each campaign, and the data they contain is the subject of our analysis.
Let us turn to the main electoral characteristics of the region.
One of the most important electoral indicators is voter turnout. It is calculated from the sum of valid and invalid ballots divided by the number of voters. Analyzing turnout data by region, we can conclude that the highest turnout is observed in remote areas in its northern and south-western parts. As a rule, these are territories with an extremely complex transport and logistics infrastructure, which seriously complicates the possibilities for normal electoral control. There is a clear correlation between turnout and urbanization levels. Progressing from the center to the periphery shows that decreasing urbanization and increasing voter turnout. For example, there is only one urban settlement in the Severo-Yeniseysky District, the front-runner in turnout, and it is only an urban-type settlement at that. Other turnout front-runners, Bolsheuluysky and Sharypovsky districts, do not have any urban settlements. In 2016, peripheral Severo-Yeniseysky, Bolsheuluysky, Sharypovsky, Dzerzhinsky, Ilimpiysky districts and Solnechny settlement were leading in voter turnout. The outsiders in turnout were Beryozovsky District as well as towns of Norilsk, Achinsk, Lesosibirsk and Kansk. In 2021, the group of front-runners has not changed, except for the addition of Bogotolsky District. The 2021 turnout outsiders were Yemelyanovsky District, Sovetsky, Leninsky, Sverdlovsky, Oktyabrsky districts of the city of Krasnoyarsk, as well as the towns of Kansk and Lesosibirsk. The turnout increased the most (by 15%) in Turukhansky, Beryozovsky, Kazachinsky, Sharypovsky districts, Solnechny settlement and the town of Achinsk indicated turnout increase of over 10% each. Decreased turnout in the range of 1.5% occurred in Abansky, Ilimpiysky, Boguchansky, Bolsheuluysky and Irbeisky districts. The largest decrease in turnout (by 5%) occurred in one of the two parts of Yemelyanovsky District. The introduction of three-days voting in the September 17–19, 2021 elections, as well as a more organized mobilization campaign, seems to have played a significant role in the increase in turnout.
As for the number of invalid ballots, it was about the same in the two campaigns in the region. In the district context, the situation was as follows. In 2016, the leaders in the number of invalid ballots were the three TECs in Evenkiysky District (3.82–4.28%), Kansky District (4%), Kuraginsky District (3.94%) and Minusinsky District (3.75%), as well as Kirovsky District of the city of Krasnoyarsk (4.27%). In 2021, this group was joined by Turukhansky (7.22%) and Boguchansky (5.88%) districts as well as three TECs in Evenkiysky District (4.44–5.04%), and Kedrovy settlement (4.12%). When comparing the two federal elections, the greatest increase in the number of invalid ballots was observed in Turukhansky District (5.51%), TEC No. 1 in Taimyrsky Dolgano-Nenetsky District (1.60%), Karatuzsky District (1.51%) and Mansky District (1.13%). The number of invalid ballots decreased in Krasnoyarsk (by districts: from 0.35% in Tsentralny District to 1.46% in Kirovsky District), Solnechny settlement (0.57%) and Pirovsky District (0.50%).
33 957 people voted outside the voting premises in 2016, and 62 547 did in in 2021. Bogotolsky (15.88%), Kozulsky (14.94%), Bolshemurtinsky (13.98%) and Karatuzsky (13.34%) districts were leading in outside voting in 2016. The 2021 group of districts leading in outside voting included Motyginsky (27.57%; it also indicated the largest increase in the number), Bogotolsky (26.20%), Partizansky (23.20%), Sharypovsky (22.44%), Sukhobuzimsky (20.63%). The percentage of voting increased in all towns and districts of the Krai, except for Shushensky and Tungusso-Chunsky districts, TEC No. 2 of Taimyrsky District and the town of Sharypovo.
The list of election participants presents the biggest interest.
Fourteen political parties ran in the 2016 State Duma election: United Russia, CPRF, A Just Russia, LDPR, Yabloko, Patriots of Russia, Party of Growth, PARNAS, Civic Platform, Communists of Russia, Russian Party of Pensioners for Justice (RPPJ), Rodina, Civilian Power, and REP The Greens [5]. Out of this list, Patriots of Russia (merged with A Just Russia), PARNAS and Civilian Power did not participate in the 2021 election. The newcomer parties included New People, Green Alternative (both established in 2020) and Russian Party of Freedom and Justice (formerly known as Communist Party for Social Justice, created in 2012 and renamed in 2021).
As can be seen from Table 1, CPRF, A Just Russia, RPPJ, and REP The Greens gained in both relative and absolute value in the 2021 election as compared to the 2016 election. The number of invalid ballots remained largely unchanged.
Table 1. Comparative results of the 2016 and 2021 State Duma elections in Krasnoyarsk Krai, number of votes and share of voters
| 18 Sep 2016 | 17-19 Sep 2021 | |
| Number of voters in the region | 2175304 | 2078095 |
| Turnout | 796474 (36.61%) | 862904 (41.52%) |
| Invalid ballots | 22762 (2.85%) | 24673 (2.86%) |
| United Russia | 322136 (40.45%) | 298890 (34.64%) |
| CPRF | 114766 (14.41%) | 197393 (22.88%) |
| LDPR | 161354 (20.26%) | 118007 (13.68%) |
| A Just Russia | 38706 (4.86%) | 53006 (6.14%) |
| Patriots of Russia | 40881 (5.13%) | — |
| New People | — | 67633 (7.84%) |
| Communists of Russia | 24393 (3.06%) | 18420 (2.13%) |
| Yabloko | 12535 (1.57%) | 6598 (0.76%) |
| Russian Party of Pensioners for Social Justice | 17546 (2.20%) | 25423 (2.95%) |
| Party of Growth | 8109 (1.02%) | 2202 (0.26%) |
| Rodina | 14621 (1.84%) | 7013 (0.81%) |
| PARNAS | 6165 (0.77%) | — |
| REP The Greens | 9182 (1.15%) | 29243 (3.39%) |
| Green Alternative | — | 7781 (0.90%) |
| Russian Party of Freedom and Justice | — | 5478 (0.63%) |
| Civic Platform | 2041 (0.26%) | 1144 (0.13%) |
The table is not fully displayed Show table
Data sourced from Krasnoyarsk Krai Election Commission: http://www.krasnoyarsk.izbirkom.ru/arkhiv-vyborov-i-referendumov/
Analyzing Election results in the intra-regional context at the level of cities and districts of the Krai also yields interesting results (see Table 2).
Table 2. Comparative results of political parties in the 2016 and 2021 elections, percentages
| District or city/town | 2016 turnout | 2021 turnout | UR 2016 | UR 2021 | CPRF 2016 | CPRF 2021 | LDPR 2016 | LDPR 2021 | AJR 2016 | AJRFT 2021 |
| Abansky | 41.69 | 41.53 | 45.33 | 39.02 | 14.02 | 25.29 | 19.28 | 9.41 | 9.75 | 10.69 |
| Achinsky | 37.40 | 44.58 | 44.32 | 37.35 | 11.07 | 20.99 | 23.96 | 17.48 | 4.04 | 6.02 |
| Achinsk (town) | 31.78 | 42.41 | 33.57 | 32.29 | 14.40 | 22.50 | 26.13 | 14.94 | 6.63 | 7.97 |
| Baikitsky | 51.05 | 59.52 | 54.66 | 33.12 | 7.70 | 17.37 | 20.10 | 15.89 | 4.12 | 9.81 |
| Balakhtinsky | 52.62 | 56.65 | 52.23 | 39.07 | 12.59 | 28.25 | 18.55 | 10.83 | 1.72 | 4.18 |
| Beryozovsky (const, 54) | 26.90 | 42.04 | 43.71 | 26.91 | 13.66 | 18.07 | 20.89 | 39.04 | 2.54 | 2.21 |
| Beryozovsky (const, 55) | 31.30 | 43.23 | 44.07 | 37.60 | 10.46 | 18.89 | 20.73 | 20.15 | 3.72 | 4.53 |
| Birilyussky | 38.49 | 44.31 | 46.96 | 41.16 | 15.95 | 21.72 | 21.61 | 13.25 | 2.67 | 6.04 |
| Bogotolsky | 52.05 | 58.25 | 53.94 | 47.11 | 11.39 | 25.01 | 22.31 | 10.56 | 2.09 | 4.53 |
| Bogotol (town) | 34.07 | 41.14 | 41.94 | 30.10 | 17.20 | 35.47 | 21.90 | 10.05 | 3.57 | 5.42 |
| Boguchansky | 43.48 | 42.90 | 39.70 | 27.85 | 20.55 | 30.87 | 21.92 | 10.71 | 3.96 | 4.61 |
| Bolshemurtinsky | 38.40 | 44.97 | 49.98 | 38.10 | 13.83 | 22.82 | 20.10 | 13.19 | 1.94 | 5.94 |
| Bolsheuluysky | 56.45 | 55.12 | 52.99 | 38.98 | 9.05 | 17.39 | 19.35 | 14.77 | 4.04 | 12.80 |
| Borodino (town) | 38.61 | 43.98 | 35.53 | 28.45 | 23.19 | 32.21 | 21.89 | 11.07 | 4.06 | 6.57 |
| Dzerzhinsky | 54.13 | 58.86 | 51.86 | 40.27 | 12.34 | 24.49 | 22.42 | 12.71 | 1.54 | 4.15 |
| Divnogorsk (town) | 35.34 | 44.89 | 40.51 | 31.62 | 16.59 | 23.47 | 20.07 | 19.40 | 4.02 | 5.24 |
| Yemelyanovsky (const, 55) | 33.20 | 34.40 | 42.18 | 30.52 | 12.29 | 24.24 | 19.76 | 14.79 | 3.30 | 6.41 |
| Yemelyanovsky (const, 56) | 37.15 | 31.74 | 44.36 | 28.07 | 15.56 | 24.81 | 14.54 | 17.94 | 3.45 | 6.23 |
| Yeniseysky | 40.60 | 46.34 | 39.45 | 35.30 | 14.06 | 15.98 | 27.87 | 20.31 | 2.82 | 7.37 |
The table is not fully displayed Show table
Data sourced from Krasnoyarsk Krai Election Commission: http://www.krasnoyarsk.izbirkom.ru/arkhiv-vyborov-i-referendumov/
When it comes to electoral zoning of individual parties, the situation is as follows. United Russia's electoral geography is largely stable. Both in 2016 and in 2021, the resource-producing north of the Krai (Taimyrsky, Evenkiysky, Severo-Yeniseysky districts), as well as agricultural areas (Nazarovsky, Bogotolsky, Sharypovsky, Idrinsky districts) voted for United Russia the most, as is always the case. Norilsk, the region's largest industrial center, joined this group in 2021. Therefore, northern and southwestern parts of the region indicate increased support for the party. Urban territories are the outsiders when it comes to voting for the party of power; that includes the regional center (capital), Krasnoyarsk, as well as the towns of Zelenogorsk, Yeniseysk, Sharypovo, Borodino. In both 2016 and 2021, the party received less support in a number of eastern districts: Kezhemsky, Boguchansky, and Motyginsky. As for the party's electoral dynamics between the two elections, the party suffered the greatest losses in Evenkiysky District (-20%), Nazarovsky District (-18.5%), Taimyrsky Municipal District (-15%), Turukhansky District (-15.4%), Pirovsky District (-14.7%), Bolsheuluysky and Idrinsky districts (-14%). A slight increase in support for the party was observed in Kansky District, Kirov District of Krasnoyarsk, and Solnechny settlement (0.18–2.59%). Norilsk indicated the greatest increase in support (+9.78%) (see Table 2).
Results dynamics show that United Russia suffered the greatest losses in the northern part of the region. This is likely because United Russia member Aleksei V. Veller ran in Yeniseysky single-seat constituency No. 57 (which includes the region's northern territory). Veller is a State Duma deputy for Murmansk Oblast and former mayor of Murmansk, and has never lived in Krasnoyarsk Krai. It seems like a "varyag" (loosely translated as "outsider") candidate turned a significant portion of voters away from the party.
In 2016, CPRF received the highest support in the southern districts of Krasnoturansky, Shushensky and Minusinsky, the town of Minusinsk, and in the eastern towns of Zelenogorsk and Borodino. In 2021, the greatest support for the party came from Uzhursky, Krasnoturansky, Idrinsky, Shushensky, Sharypovsky, Minusinsky districts, the towns of Bogotol, Sharypovo and Borodino. CPRF received the least support in the northern districts of (Norilsk, Taimyrsky and Evenkiysky Districts). In 2021, the party's results increased in all territories except Norilsk. The greatest growth was spotted in Nazarovsky, Uzhursky, Idrinsky, Balakhtinsky districts, the towns of Bogotol and Sharypovo (see Table 2). What strikes the attention is that the biggest increase in support occurred in the territories that are part of Divnogorsk single-seat constituency, where party candidate Boris V. Melnichenko gained the highest result among the CPRF single-seat candidates in the region. The party's result also increased in Krasnoyarsk, where Patriots of Russia, supported by well-known local politician Anatoly P. Bykov, took away a considerable part of leftist electorate in the previous elections.
In 2016, LDPR received the highest support in Mansky, Yeniseysky, Kezhemsky, Motyginsky, Kansky, Irbeysky, Sayansky and Nizhneingashsky districts as well as the town of Yeniseisk. In 2021, the greatest support for the party came from Beryozovsky, Yeniseysky, Irbeysky, Sayansky, Mansky districts as well as the town of Divnogorsk. In 2021, the party's results increased only in Beryozovsky and Yemelyanovsky districts. The results decreased in all other territories, with the largest decrease occurring in Kezhemsky District (-17.22%). The party lost over 10% of the votes in the town of Yeniseisk, Solnechny settlement, Mansky, Tyukhtetsky, Motyginsky, Uzhursky districts (see Table 2). At the same time, the north indicated the smallest decrease: despite United Russia's general failure, there was a concentration of protest votes, including around LDPR. Among the reasons for the party's failure were a weak federal campaign, staff losses in the region, a number of local politicians leaving the party as well as voluntary withdrawal from the elections to the State Duma of Alexander Gliskov, one of the promising candidates of the party [6]. United Russia was highly successful is the Beryozovsky District only, which indicated the party's best result across the country, and where, a year before the Duma election, LDPR won the election to the district council of deputies. It is also noteworthy that LDPR was accused of buying votes in this district [4].
In 2016, A Just Russia received the highest support in Sverdlovsky, Kirovsky, Zheleznodorozhny, Oktyabrsky, Sovetsky districts of Krasnoyarsk, Abansky, Taseyevsky districts, Ilimpiyskaya TEC in Evenkiysky District as well as towns of Zelenogorsk, Achinsk and Minusinsk. In 2021, the greatest support for the newly merged A Just Russia – For Truth came from Ilimpiyskaya and Tungussko-Chunskaya TECs in Evenkiysky District, Bolsheuluysky, Abansky and Taseyevsky districts as well as towns of Zelenogorsk and Lesosibirsk. Compared to the 2016 elections, the largest increase in the 2021 elections was registered in Ilimpiysky and Baikitsky TECs in Evenkiysky District, Bolsheuluysky, Kezhemsky, Mansky and Yeniseysky districts as well as the towns of Lesosibirsk and Yeniseysk. The percentage of votes for the party decreased in Krasnoyarsk and Minusinsk (see Table 2).
The 2021 election newcomer New People party had notable success in Zheleznogorsk (12.09%), Tsentralny (11.71%), Sovetsky (10.92%), Zheleznodorozhny (9.77%), Oktyabrsky (9.63%) districts of Krasnoyarsk and in Zelenogorsk (10.65%). All in all, we can say that the party revealed its urban character.
There are many methods for working with electoral statistics [8]. The most common are sociological (observation method, population survey method, document analysis method), statistical (analysis of aggregate data, correlation analysis, coefficient of variation), geographical (mapping method).
In this article, we shall use statistical methods of election analysis. They allow for a numerical analysis of election results based on numerical indicators.
The most common statistical method for electoral studies is the calculation of data correlation. Linear correlation method, developed by Karl Pearson, makes it possible to obtain a large volume of quantitative indicators that characterize the population's electoral preferences and their dynamics. In its essence, correlation analysis method aims to establish a statistical relationship between two sets of data. In this case, it can be a calculation of the correlation between the results of parties and candidates both in the same election and different ones; a calculation of the correlation between vote returns and socio-economic indicators. The correlation coefficient varies from -1 to 1. The final result of the calculations is a correlation matrix where the units are lined up on its diagonal (the correlation coefficient between the same data set equals 1), and calculated coefficients themselves are placed in the remaining part. At the same time, we have to point out that the two data sets that are equal in number should be compared. In our case, they were calculated based on the data from TECs across the region.
In his work, Nikolai Grishin notes that a high positive correlation means that there is geographical unanimity when election participants have similar electoral zoning. In other words, the more people in a given territory vote for one election participant, the more people in that same territory vote for another election participant. A strong negative correlation means an electoral split, meaning the more people vote for one electoral participant in a given territory, the less people vote for another in that same territory. A correlation value close to 0 indicates that there is no connection between electoral zoning of election participants, meaning voting for these candidates happens independently [2: 41–42].
Validity of the correlation between the arrays can be assessed using Student's t-test. The critical values of the correlation coefficient depend on the number of numbers in the array (the number of territories or polling stations). Therefore, at the significance level of 5% for arrays of 72 numbers, a correlation coefficient greater modulo than 0.23 can be considered reliable [7].
The analysis of political party support for the 2016 election analyzed the correlations between the results of 12 out of 14 participant parties (those that received over 0.5% of the vote in the region). Civic Platform and Civilian Power were excluded from analysis since their results in the region were minuscule (0.26% and 0.16%, respectively). The resulting correlation matrix is presented in Table 3.
Table 3. Correlation matrix between political parties participating in the 2016 election by districts of Krasnoyarsk Krai
| Rodina | CoR | RPPJ | UR | Greens | LDPR | PARNAS | PoG | Yabloko | CPRF | PoR | AJR | |
| Rodina | 1 | |||||||||||
| CoR | 0.08 | 1 | ||||||||||
| RPPJ | -0.07 | 0.03 | 1 | |||||||||
| UR | -0.49 | -0.49 | -0.02 | 1 | ||||||||
| Greens | 0.64 | -0.14 | -0.19 | -0.49 | 1 | |||||||
| LDPR | 0.01 | 0.27 | 0.17 | -0.35 | -0.29 | 1 | ||||||
| PARNAS | 0.62 | 0.02 | -0.20 | -0.57 | 0.89 | -0.33 | 1 | |||||
| PoG | 0.57 | -0.07 | -0.12 | -0.58 | 0.91 | -0.26 | 0.91 | 1 | ||||
| Yabloko | 0.65 | -0.05 | -0.16 | -0.54 | 0.92 | -0.32 | 0.93 | 0.93 | 1 | |||
| CPRF | 0.06 | 0.58 | 0.09 | -0.63 | -0.11 | 0.20 | 0.05 | 0.02 | 0.02 | 1 | ||
| PoR | 0.35 | 0.10 | -0.28 | -0.45 | 0.75 | -0.39 | 0.80 | 0.77 | 0.75 | -0.12 | 1 | |
| AJR | 0.36 | -0.19 | -0.10 | -0.46 | 0.62 | -0.34 | 0.58 | 0.60 | 0.58 | 0.10 | 0.47 | 1 |
Legend: CoR – Communists of Russia, RPPJ – Russian Party of Pensioners for Justice, UR – United Russia, PoG – Party of Growth, PoR – Patriots of Russia, AJR – A Just Russia. Data sourced from Krasnoyarsk Krai Election Commission: http://www.krasnoyarsk.izbirkom.ru/arkhiv-vyborov-i-referendumov/
According to the results of the study, participant parties can be divided into four groups. The first group includes liberal parties (Yabloko, PARNAS, and Party of Growth), Rodina, Patriots of Russia, REP The Greens, and A Just Russia — all have a fairly strong correlation between them (up to 0.93 between the liberal parties). At the same time, there is virtually no correlation with other parties.
The second group includes CPRF and Communists of Russia. They have a fairly good correlation with each other, but almost no correlation with the liberal parties, Rodina, and A Just Russia.
The third group of parties includes LDPR and the RPPJ. They have a negative correlation with the liberal parties and a weak correlation with all the remaining parties.
The fourth group is represented by United Russia, which has a negative correlation with all election participants.
Most interesting are correlation coefficient values between the parties that are considered ideologically close. We have already pointed out a high (sometimes close to absolute) degree of correlation between Yabloko, PARNAS, REP The Greens and Party of Growth. Also noteworthy is the fairly high correlation between the Communist parties — CPRF and Communists of Russia. At the same time, there is virtually no correlation between the parties that declare "justice": A Just Russia and the RPPJ.
Let us examine the correlations based on the results of the 2021 election (see Table 4). We also analyzed the results by districts for 12 out of the 14 political parties that received over 0.5% of votes in the region (in this case, Civil Platform and Party of Growth were excluded from analysis).
Table 4. Correlation matrix between political parties participating in the 2021 election by districts of Krasnoyarsk Krai
| CPRF | Greens | LDPR | New People | UR | AJRFT | Yabloko | RPSS | CPCoR | GA | Rodina | RPPSJ | |
| CPRF | 1 | |||||||||||
| Greens | -0.05 | 1 | ||||||||||
| LDPR | -0.45 | -0.02 | 1 | |||||||||
| New People | 0.07 | 0.67 | -0.11 | 1 | ||||||||
| UR | -0.45 | -0.47 | -0.16 | -0.65 | 1 | |||||||
| AJRFT | -0.22 | 0.03 | -0.24 | 0.22 | -0.24 | 1 | ||||||
| Yabloko | -0.23 | 0.77 | -0.18 | 0.52 | -0.25 | 0.02 | 1 | |||||
| RPSS | -0.20 | 0.42 | -0.08 | 0.30 | -0.13 | 0.16 | 0.44 | 1 | ||||
| CPCoR | 0.60 | -0.14 | -0.20 | 0.03 | -0.31 | -0.27 | -0.23 | 0.02 | 1 | |||
| GA | -0.13 | 0.76 | -0.10 | 0.62 | -0.42 | 0.19 | 0.69 | 0.43 | -0.12 | 1 | ||
| Rodina | -0.01 | 0.38 | 0.07 | 0.46 | -0.41 | 0.06 | 0.37 | 0.34 | 0.02 | 0.31 | 1 | |
| RPPSJ | -0.13 | 0.16 | 0.08 | 0.43 | -0.36 | 0.14 | 0.06 | 0.10 | 0.17 | 0.34 | 0.27 | 1 |
Legend: UR – United Russia; AJRFT – A Just Russia—For Truth; RPSS – Russian Party of Freedom and Justice; CPCR – Communist Party "Communists of Russia"; GA – Green Alternative; RPPSJ – Russian Party of Pensioners for Social Justice Data sourced from Krasnoyarsk Krai Election Commission: http://www.krasnoyarsk.izbirkom.ru/arkhiv-vyborov-i-referendumov/
What do we see as a result? Correlations between election contestants have weakened markedly. Only Yabloko and REP The Greens retained the strongest correlation, and they both also have significant correlations with the two newcomers — New People and Green Alternative. There is also a visble correlation between New People, Russian Party of Freedom and Justice and Russian Party of Pensioners for Social Justice. Although Rodina now has weaker correlation with Yabloko and REP The Greens, it still remains at a relatively high level: 0.37 with the former and 0.38 with the latter. As for the A Just Russia – For Truth, it only has any significant correlation with New People this time.
We also have to point out the high correlation between the parties that use similar words in their names: CPRF and Communists of Russia, REP The Greens and Green Alternative. However, there is virtually no correlation between the parties that use the word "justice" in any form (A Just Russia – For Truth, Russian Party of Freedom and Justice and Russian Party of Pensioners for Social Justice).
In order to reveal the continuity of results, we can calculate correlation coefficient between party results by district in the 2016 and 2021 elections. The correlation coefficients for different parties is as follows: 0.73 for United Russia, 0.68 for CPRF, 0.51 for A Just Russia, 0.55 for Communists of Russia, 0.31 for RPPSJ, 0.85 for REP The Greens, 0.84 for Yabloko, 0.42 for Rodina and only 0.22 for LDPR.
The correlation coefficients reflect not so much the common ideological ground of parties, but more so the social proximity of their electorates. In particular, the results of Patriots of Russia, PARNAS, Party of Growth (in 2016), New People, Green Alternative (in 2021) and Yabloko were significantly higher in the regional center, while United Russia, CPRF, Communists of Russia and the RPPSJ were more successful in the region's periphery.
In the meantime, electoral zoning of parties underwent some changes between the two elections. Regarding LDPR, we see that the party is getting more urban, primarily because of the party's higher than the regional average result in the regional center (it is 0.7% higher than the regional average; in 2016, it was 4.5% lower). A Just Russia, on the other hand, gained 2% more in 2016, and only 0.3% more in 2021 (more than the regional average both times). Therefore, the decrease in the correlation between the parties can also be explained by a decrease in the differences between the territories and smoothed out difference between urban and rural areas. Candidates campaigning in single-seat constituencies could also have played a certain role, as it could have increased the results of the parties that nominated the candidates.
Another interesting feature of comparing election results is the process of vote redistribution between two elections. For this purpose, we calculated correlation coefficients for the difference in results for the parties that showed significant results in the region in both federal campaigns — United Russia, CPRF, LDPR, A Just Russia, REP The Greens (who participated in both 2016 and 2021) — with the results of Patriots of Russia (participated only in 2016) and New People (participated in 2021). The most interesting points seem to be the process of vote redistribution from Patriots of Russia, which in 2016 showed the best nationwide result in the region as well as finding out the origin of New People's electorate.
To calculate the correlations, we divided the region into two parts: the first corresponded to the territories of single-seat constituencies No. 54–56 (these include 43 TECs in southern and central territories). Beryozovsky District TEC, which contributed an abnormally high result to LDPR, was excluded from the analysis. The second group corresponded to constituency No. 57 (which includes 28 territorial commissions — the northern territories). Aside from geographical division, it should be noted that constituencies No. 54–56 indicated a much higher result for Patriots of Russia, while few votes were cast for the party in constituency No. 57, so the redistribution of a small number of votes is of no interest. Besides, Constituency No. 57 does not include the territory of the regional center, where the result of Patriots of Russia is almost twice as high as in the region.
For consistency purposes, the 2016 results of Patriots of Russia were considered with a minus sign, since the party did not participate in the 2021 election (that is, we technically calculated the difference between 0 and the party's result in 2016). Therefore, in all cases, negative correlations indicated a possible overflow of votes from one party to another. We can also assume that positive correlations between party differences indicate that parties were likely taking votes away from the same other parties, or vice versa.
Table 5. Correlations of vote percentage change between political parties in single-seat constituencies No. 54-56
| ЕР 2021/2016 | CPRF 2021/2016 | LDPR 2021/2016 | AJR 2021/2016 | PoR 2016 | NP 2021 | REPG 2021/2016 | |
| UR 2021/2016 | 1 | ||||||
| CPRF 2021/2016 | -0.74 | 1 | |||||
| LDPR 2021/2016 | -0.05 | -0.25 | 1 | ||||
| AJR 2021/2016 | -0.37 | 0.16 | -0.48 | 1 | |||
| PoR 2016 | -0.16 | 0.12 | -0.67 | 0.52 | 1 | ||
| NP 2021 | 0.24 | -0.35 | 0.25 | -0.39 | -0.58 | 1 | |
| REPG 2021/2016 | 0.09 | -0.07 | 0.50 | -0.61 | -0.86 | 0.71 | 1 |
Abbreviations: UR – United Russia, AJR – A Just Russia, PoR – Patriots of Russia, NP – New People, REPG – Russian Ecological Party "The Greens". Data sourced from Krasnoyarsk Krai Election Commission: http://www.krasnoyarsk.izbirkom.ru/arkhiv-vyborov-i-referendumov/
Table 6. Correlations of vote percentage change between political parties in single-seat constituency No. 57
| UR 2021/2016 | CPRF 2021/2016 | LDPR 2021/2016 | AJR 2021/2016 | PoR 2016 | NP 2021 | REPG 2021/2016 | |
| UR 2021/2016 | 1 | ||||||
| CPRF 2021/2016 | -0.28 | 1 | |||||
| LDPR 2021/2016 | -0.59 | -0.27 | 1 | ||||
| AJR 2021/2016 | -0.32 | -0.26 | 0.04 | 1 | |||
| PoR 2016 | -0.11 | 0.34 | -0.07 | 0.23 | 1 | ||
| NP 2021 | -0.17 | 0.04 | -0.28 | 0.13 | 0.09 | 1 | |
| REPG 2021/2016 | -0.18 | 0.04 | -0.15 | -0.08 | 0.04 | 0.44 | 1 |
Abbreviations: UR – United Russia, AJR – A Just Russia, PoR – Patriots of Russia, NP – New People, REPG – Russian Ecological Party "The Greens". Data sourced from Krasnoyarsk Krai Election Commission: http://www.krasnoyarsk.izbirkom.ru/arkhiv-vyborov-i-referendumov/
As can be seen from Table 5, negative correlations between CPRF and United Russia, A Just Russia and United Russia, and A Just Russia and LDPR are significant for the central and southern parts of the region (over 0.3). Patriots of Russia has significant correlations with LDPR, New People and with REP The Greens especially; New People also has significant correlations with CPRF and A Just Russia. For the northern part of the region (Table 6), only the negative correlation between United Russia and LDPR is significant (over 0.37).
Significant negative correlations tell us about a possible overflow of votes from one party to another, but they cannot tell us anything about its scale. We shall use regression analysis to solve this problem. Let us build party results difference dependency graphs for the four pairs with the highest correlation coefficients for districts No. 54–56.
The most pronounced overflow of votes can be seen for the "Patriots of Russia / REP The Greens" pair (Fig. 1). We can see that regression line crosses the ordinate axis close to the origin (the free term in the regression equation is 0.0025), which means that the correlation is almost directly proportional. The slope of the regression line is 0.32. We can thus conclude that about a third of voters who supported Patriots of Russia in 2016 voted for REP The Greens this time around. Given that Patriots of Russia received about 38,000 votes in districts No. 54–56 in 2016, the overflow in favor of REP The Greens was about 12,000 votes, while in the given area, REP The Greens received about 18,000 more votes in 2021 than it did in 2016. In other words, most of REP The Greens' increase came from Patriots of Russia voters.
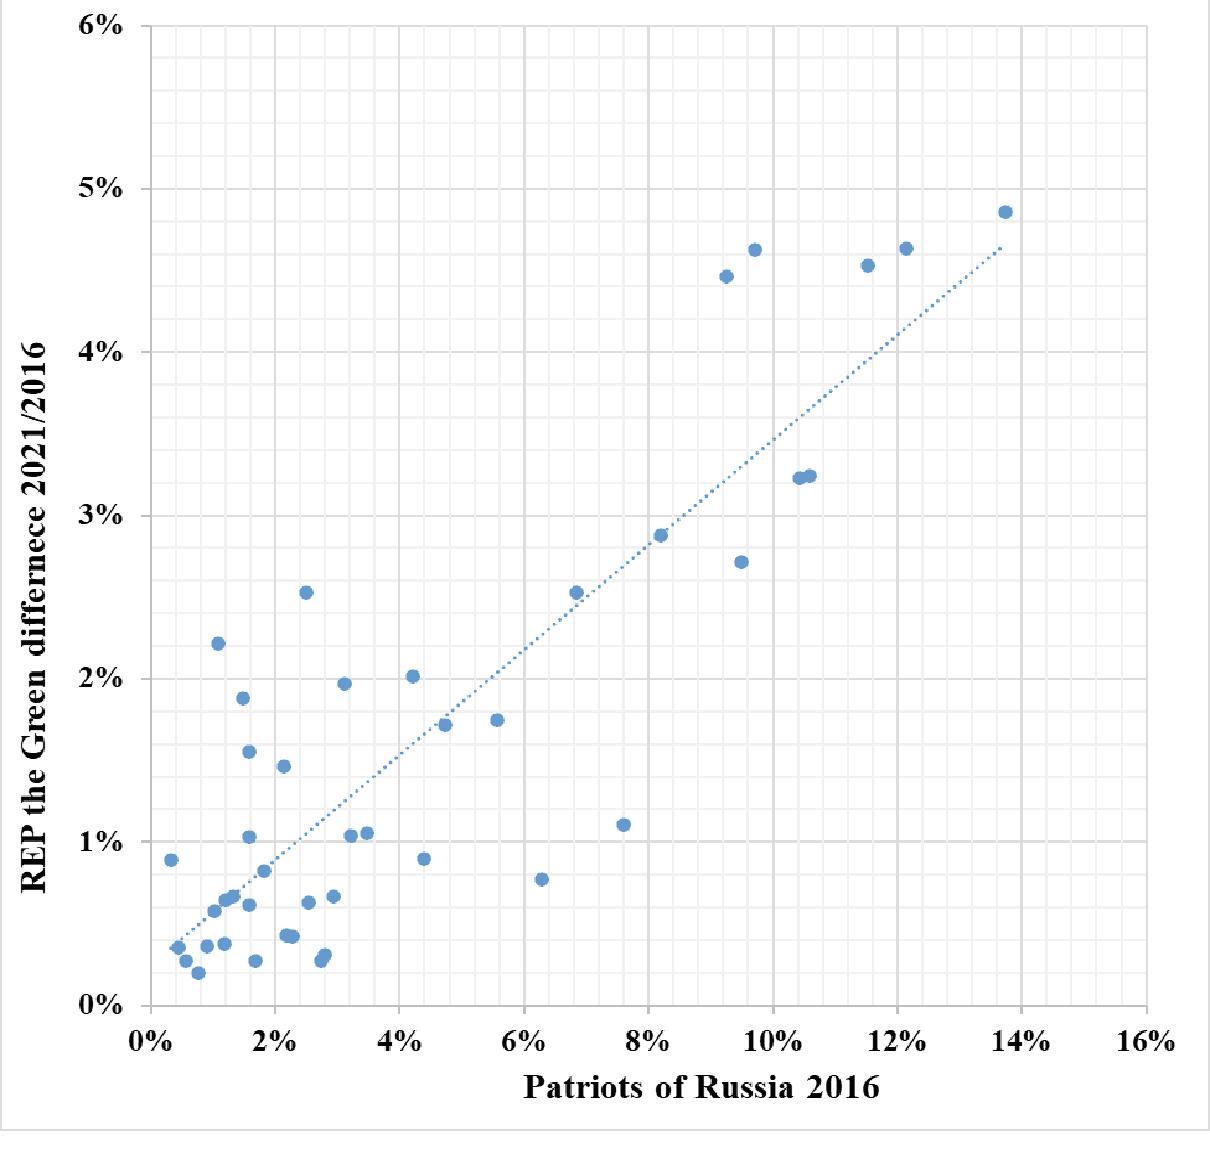
Fig. 1. Dependency of REP The Greens vote increase in 2021 (compared to 2016) on the share of votes for Patriots of Russia in 2016. Dots are districts and cities of single-seat constituencies No. 54—56 in Krasnoyarsk Krai
Less pronounced is the vote overflow from Patriots of Russia to New People (Fig. 2). There is a greater dispersion of dots here, which is associated with extreme heterogeneity of Patriots of Russia's results (as evidenced by the lower value of the correlation coefficient, see Table 5). The free term of the regression equation is 0.05 and the slope coefficient is 0.36. In this case, our overflow estimates are less accurate. Nevertheless, it can be assumed that New People have received at least 14 thousand votes from Patriots of Russia, but their total share of these votes in constituencies 54–56 (55 thousand votes) is not the largest.
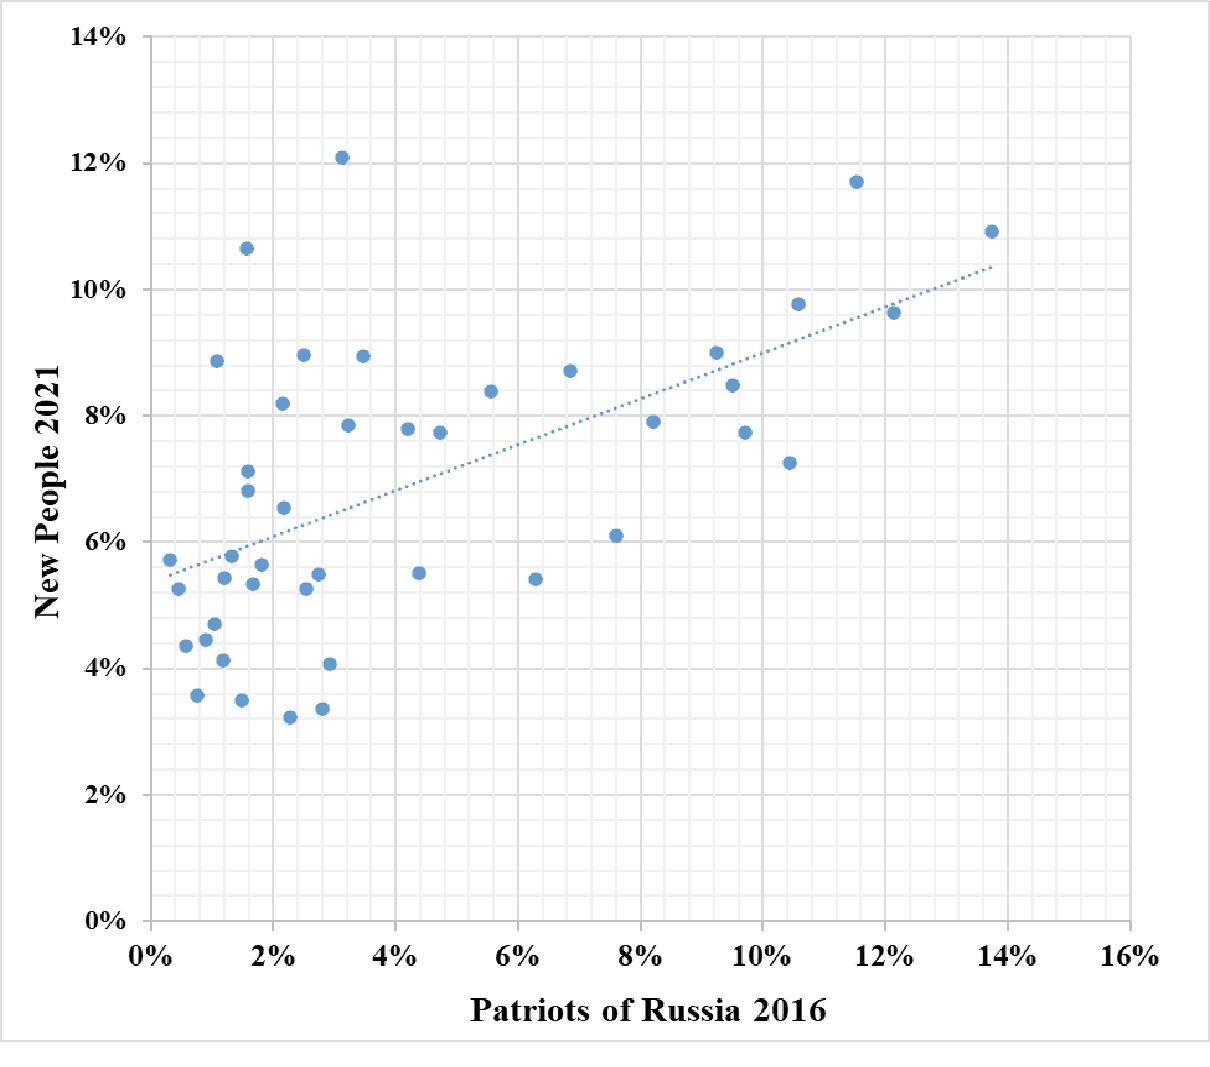
Fig. 2. Dependency of New People result of in 2021 on the share of votes for Patriots of Russia in 2016. Dots are districts and cities of single-seat constituencies No. 54—56 in Krasnoyarsk Krai
The data in Table 5 also indicates vote overflow from Patriots of Russia to LDPR. However, LDPR lost about 27,000 votes in 2021 compared to 2016 in constituencies 54–56. But Fig. 3 shows that LDPR's losses were noticeably lower wherever Patriots of Russia received a significant share of votes in 2016 (mostly in the region's capital), and in some territories LDPR's result improved. Therefore, Fig. 3 confirms vote overflow from Patriots of Russia to LDPR, although it is difficult to estimate its scale.
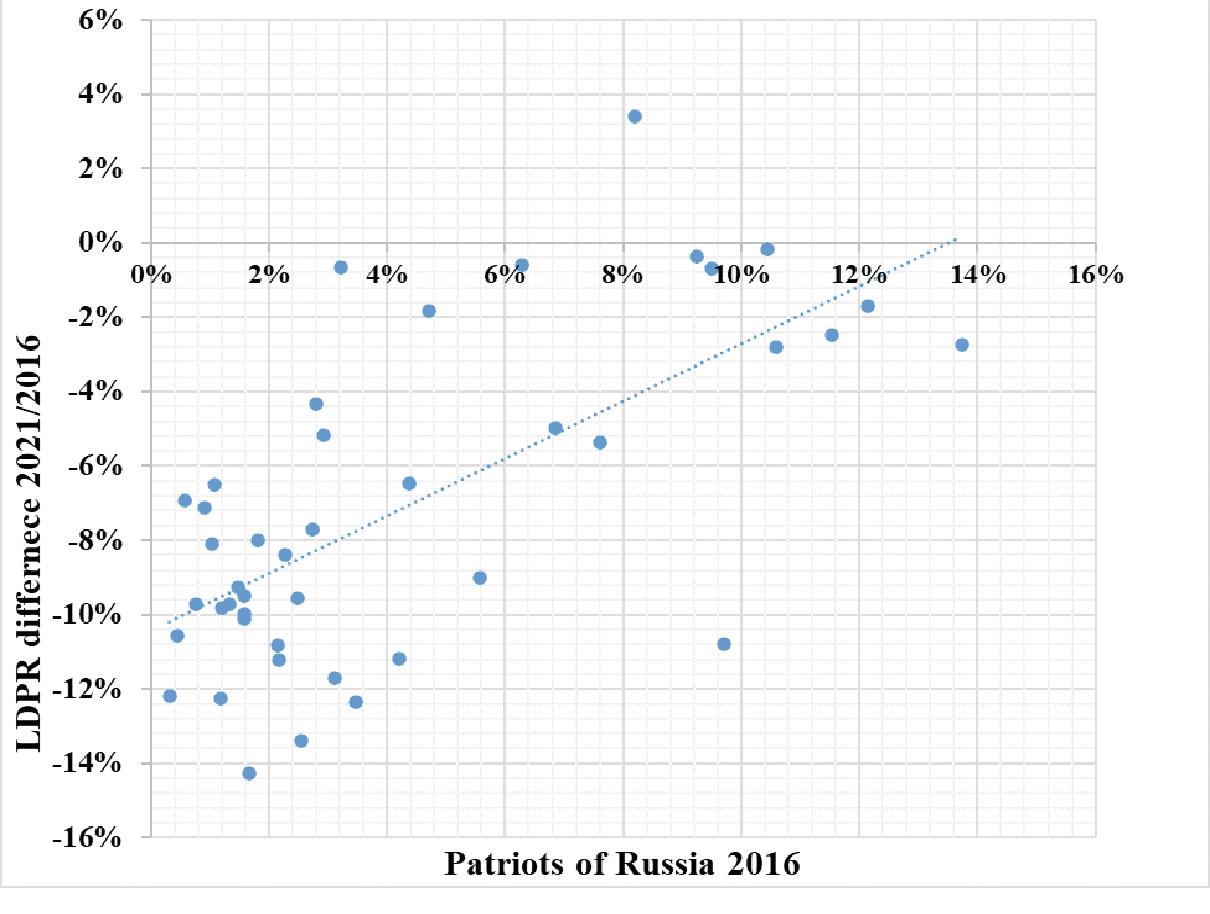
Fig. 3. Dependency of LDPR results dynamics in 2021 (compared to 2016) on the share of votes for Patriots of Russia in 2016. Dots are districts and cities of single-seat constituencies No. 54—56 in Krasnoyarsk Krai
Vote overflow from United Russia to CPRF is also interesting (Fig. 4). United Russia lost about 19,000 votes in constituencies No. 54–56, while CPRF gained about 70,000 votes. The slope of the regression line is -0.65, from which we can conclude that about two-thirds of the votes lost by United Russia went to CPRF.
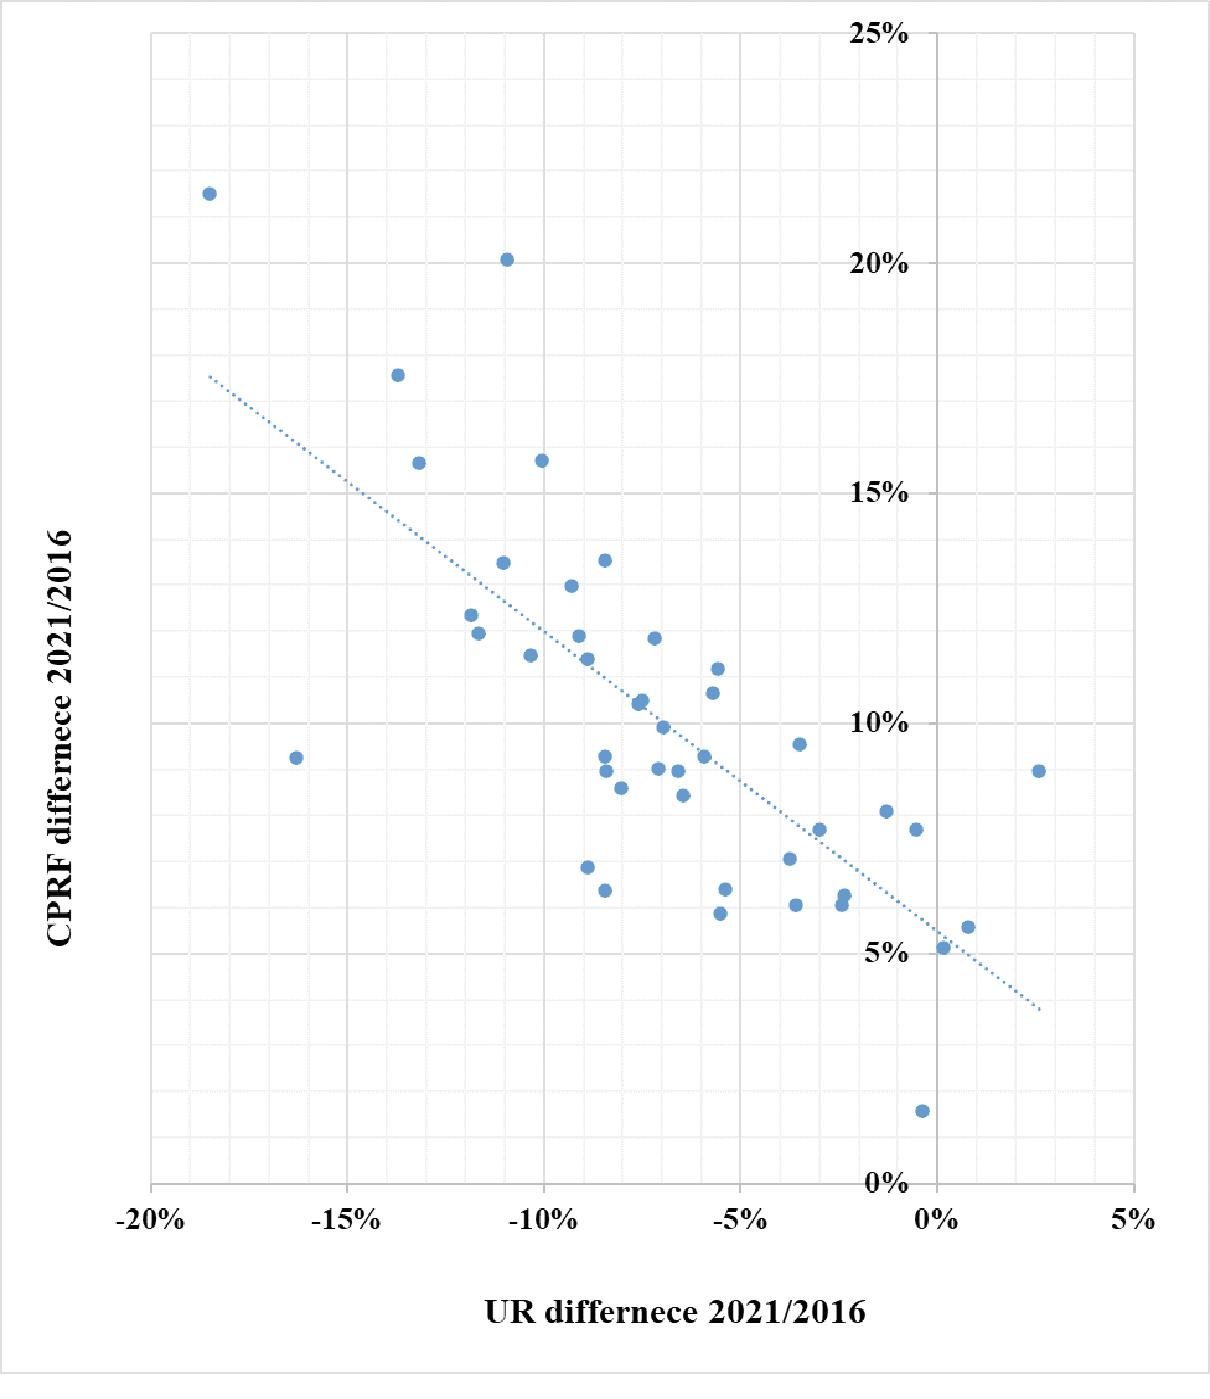
Fig. 4. Dependency of CPRF vote increase in 2021 (compared to 2016) on voting dynamics for United Russia in 2021 (compared to 2016). Dots are districts and cities of single-seat constituencies No. 54—56 in Krasnoyarsk Krai
It should be noted that the above calculations of correlation and regression coefficients do not indicate the exact actual ways of voter redistribution for political parties between the two elections, and therefore the calculations are rather tentative and estimative in nature.
There is another statistical method in the study of electoral behavior, such as variation coefficient formulation. Variation coefficient is the ratio of the standard deviation to the arithmetic mean of voting for a party in the regions of the country or in the territories of a region. Calculation of variation coefficient is used in electoral studies to reveal the level of territorial differences in voting. This coefficient helps to identify the level of regional dispersion of results. Nikolai Grishin believes that if statistical variation coefficient is less than 33%, dispersion is considered relatively homogeneous. When the critical threshold of 33% is exceeded, the range loses homogeneity [2: 40].
The higher the voting variation is, the greater the territorial differences in electoral support are. The lower the variation coefficient is, the more insignificant the differences in the vote are. On the national scale, territorial homogeneity of electoral preferences is commonly referred to as party system nationalization [9].
The table below shows variation coefficients for major political parties.
Table 7. Variation coefficients for political parties participating in the State Duma elections
| 2016 | 2021 | |
| United Russia | 19.23% | 19.63% |
| CPRF | 29.54% | 25.18% |
| LDPR | 20.82% | 33.26% |
| A Just Russia – For Truth | 51.29% | 48.74% |
| Patriots of Russia | 103.73% | — |
| New People | — | 32.39% |
| Rodina | 42.56% | 41.57% |
| Communists of Russia | 22.50% | 24.34% |
| Russian Party of Pensioners for Justice | 20.65% | 20.27% |
| REP The Greens | 53.42% | 71.44% |
| Yabloko | 77.96% | 53.56% |
Table 7 shows that United Russia, CPRF, Communists of Russia, and Russian Party of Pensioners for Social Justice retained homogeneity according to the results of the two elections. A Just Russia, REP The Greens, and Yabloko retain an unusually high variation coefficient. It is likely that the reason for this is the split between urban and rural voters. As we noted before, these parties have significantly higher support in urban areas of the region and especially in the region's capital. LDPR's results heterogeneity increased quite a lot. Also noteworthy are the very high variation coefficients of Patriots of Russia in 2016 and REP The Greens in 2021 — primarily because of the huge difference in results. For example, in 2016, Patriots of Russia received over 11% of votes in the capital, while their results almost never exceeded 2% in the rest of the region. A similar situation could be observed with REP The Greens in 2021. In Krasnoyarsk, the party got 6% of the votes, and about 2% in the rest of the region.
In summary, we offer several conclusions.
1. One of the most important electoral indicators is voter turnout. Krasnoyarsk Krai still indicates a high level of absenteeism , expressed in active non-participation of the population in elections. There are many different reasons for absenteeism: political (disappointment in government actions, lack of belief that election results can change something), socio-economic (discontent with low standard of living, price increases, unemployment), personal reasons (harvesting or crops, simple lack of desire to participate in elections, etc.). Some of the increase in turnout in 2021 can be explained by both the introduction of three-day voting and the campaign to increase turnout. Another noteworthy feature of the 2021 election is the increase in the number of people voting outside the polls.
2. Electoral zoning of political parties remains largely stable, as evidenced by high levels of correlation coefficients for elections in different years, even with New People, a fifth federal party, entering the stage in 2021. Groups of parties with general electoral zoning also largely coincide, as evidenced by correlation coefficients for the results of political parties.
3. Correlation and regression analysis helped us identify the following electorate transitions for political parties between the two elections: from Patriots of Russia to REP The Greens, New People and LDPR; from United Russia to CPRF in single-seat constituencies No. 54-56; from United Russia to LDPR in constituency No. 57.
4. Speaking of electoral dynamics of parties between the two elections, the manifesting trends are as follows: United Russia saw the largest drop in results in the north of the region (with the exception of Norilsk, which indicated the largest increase).
CPRF increased its support in almost all territories as compared to the previous election. The greatest growth is observed in the south and southwest of the region. Historically, the party had increased support in these territories, but this is where the increase was especially high the 2021 election.
LDPR, which came in second in the last election, lost a considerable amount of support this time. The north indicated the smallest decrease: despite United Russia's general failure, there was a concentration of protest votes, including around LDPR.
As for A Just Russia, there was no major cases of increase or decrease in its support. The only possible point of interest may be the increase in support for the party in Evenkiysky and Bolsheuluysky districts, as the last time the party was successful there was in the 2011 elections.
It should also be noted that the results in certain territories may have been influenced by the campaign of A Just Russia candidates in single-seat constituencies, when voters voted for the candidate and for the party that nominated them as a consequence.
Received 31.10.2021, revision received 12.12.2021.
References
- Arkhiv vyborov i referendumov [Archive of Elections and Referendums]. – Website of the Krasnoyarsk Krai Election Commission. URL: http://www.krasnoyarsk.izbirkom.ru/arkhiv-vyborov-i-referendumov/ (accessed: 30.10.2021). (In Russ.) - http://www.krasnoyarsk.izbirkom.ru/arkhiv-vyborov-i-referendumov/
- Grishin N.V. Dinamika elektoralnykh predpochteny naseleniya yuga Rossii: Sravnitelnoye issledovaniye [Dynamics of Electoral Preferences of the Population of the Russian South: A Comparative Study]. Moscow: Sotsialnopoliticheskaya MYSL, 2008. 182 p. (In Russ.)
- Kalinin V. Kurs na blagopoluchiye i sotsialnuyu podderzhku [Setting a Course on Welfare and Social Support]. – Nash Krasnoyarsky krai [Our Krasnoyarsk Krai] newspaper, 24.09.2021. URL: https://gnkk.ru/articles/kurs-na-blagopoluchie-i-socialnuyu-pod/ (accessed 30.10.2021). (In Russ.) - https://gnkk.ru/articles/kurs-na-blagopoluchie-i-socialnuyu-pod/
- Krasnoyarsky deputat rasskazala o skupke golosov v polzu LDPR [Krasnoyarsk Deputy Speaks About Vote-Buying in Favor of LDPR]. – Taiga.info website. URL: https://tayga.info/171688 (accessed 26.11.2021). (In Russ.) - https://tayga.info/171688
- Kynev A., Lyubarev A., Maksimov A. Kak vybirala Rossiya – 2016. Rezultaty monitoringa izbiratelnogo protsessa [The 2016 Russian Election. Electoral Process Monitoring Results]. Moscow: Fond “Liberalnaya missiya”. 2017. 1142 p. (In Russ.)
- Kynev A. Obshchie itogi vyborov i izbiratelnoi kampanii–2021 [General results of election and election campaign–2021]. Liberal Mission Foundation, 06.12.2021. URL: https://liberal.ru/reports/obshhie-itogi-elektoralnyh-rezultatov-izbiratelnoj-kampanii-2021?download=32099 (accessed: 12.12.2021). (In Russ.) - https://liberal.ru/reports/obshhie-itogi-elektoralnyh-rezultatov-izbiratelnoj-kampanii-2021?download=32099
- Lyubarev A.E. Vybory v Moskve: opyt dvenadtsati let. 1989–2000 [Elections in Moscow: A 12-Year Legacy. 1989–2000]. Moscow: Stolny grad, 2001. 416 p. (In Russ.)
- Lyubarev A.E. Zanimatelnaya elektoralnaya statistika [Entertaining Election Statistics]. Moscow: Golos Consulting, 2021. 304 p. (In Russ.)
- Turovsky R.F. Elektoralnoye prostranstvo Rossii: ot navyazannoi natsionalizatsii k novoi regionalizatsii? [Russia's Electoral Space: From Imposed Nationalization to a New Regionalization?]. – Politiya. 2012. No. 3. P. 100–120. (In Russ.)