 Arkadii E. Lyubarev
Candidate of Biological Sciences and Candidate of Legal Sciences, [email protected]
Assessing Territorial Homogeneity of Vote Returns in the Russian Federation and Its Regions
Abstract
The paper discusses the issue of integral assessment of territorial homogeneity (heterogeneity) of vote returns on both national and regional scale. For this purpose, we suggest using the index of party system nationalization developed by Grigorii V. Golosov. This universal indicator is termed the index of territorial homogeneity of voting (ITOG). The index values are calculated for the 1995–2021 federal elections in Russia. In the context of the 1995–2021 State Duma elections, the index is calculated for all federal subjects (regions) of Russia (except some autonomous okrugs). In the context of the 2016–2020 regional parliament elections, in index is calculated for 29 regions. The author comes to a conclusion this index is an efficient indicator of territorial homogeneity of vote returns. The paper also discusses factors that influence index values in different regions, that is, territorial division variations, socio-economic and ethnic heterogeneity of regions, and the influence of administrative resource.
Territorial homogeneity or heterogeneity of vote returns is one of the main issues in electoral geography. There are various reasons behind heterogeneity: it might be differences in sociological make-up of the electorate, historical traditions, compatriot support for certain candidates, and the influence of administrative resource. One of the tasks that stand before a researcher is to find ways to describe this heterogeneity.
There are various approaches to the study of territorial homogeneity (heterogeneity) of vote returns. For example, on can calculate indicators indicating homogeneity (heterogeneity) of voting in a particular territory for a particular party, for example, variation coefficient [7; 8]. Recent years has seen an increasing trend towards taking a spatial econometric approach to electoral research [9; 13].
The approach that allows us to obtain an integrated indicator characterizing the degree of territorial homogeneity (heterogeneity) of the voting results as a whole presents as the most diverse and productive. Such an approach has been previously developed at the national level for voting on party lists: it introduced the concept of nationalization of the party system and proposed different ways of calculating the nationalization indicator [1; 3; 4; 6; 5; 16].
This paper attempts to create a universal indicator that would indicate territorial homogeneity of vote returns. We termed it the index of territorial homogeneity of voting (ITOG). The purpose of this paper is to determine how this index is calculated and to calculate it for Russian federal and regional elections at various times.
Method for Calculating the Index of Territorial Homogeneity of Vote Returns
Grigory V. Golosov is a prominent figure when it comes to research of various methods for calculating party system nationalization index [6]. He proposed a number of criteria such an index should meet: possibility of direct calculation; decomposability into components that characterize each party; normalization (the index should take values from 0 to 1): it should take the value 0 if each party receives support in one territorial unitonly and the value 1 if all parties are equally supported in all territorial units; scale invariance; sensitivity to changes; simple calculation and clarity.
Golosov's analysis indicated that the two proposed indices meet these criteria. The first is the Jones-Mainwaring index, which is a derivative of the Gini coefficient. Its main disadvantage is the complexity of calculation: it requires a prior ranking of all components from the largest to the smallest. Like Golosov, we consider the party system nationalization index based on the Herfindahl-Hirschman concentration index a better fit in this case [4; 6; 5]. The index is expressed by the following formula:
\(I = \sum\limits_{j=1}^m((1 - \frac{n - ((\sum\limits_{i=1}^n s_{ij})^2 / \sum\limits_{i=1}^n s_{ij}^2)}{n - 1})p_j)\) ,
where \(n\) is the number of territorial units; \(m\) is the number of parties participating in the elections; \(s_{ij}\) is the share of votes received by \(j\) party in \(i\) territorial unit; \(p_j\) is the share of votes received by \(j\) party in the country (or region) as a whole.
It is important to note that testing on a large transnational database indicated a high level of correlation (0.997) between the values of the Jones-Mainwaring index and the index proposed by Golosov [5]. Therefore, with a simpler calculation method, Golosov's nationalization index yields results comparable to those of the Jones-Mainwaring index.
At the same time, we believe is it fundamental that \(p_j\) is calculated as a fraction of the number of valid ballots, that is, the sum of \(p_j\) must equal one — otherwise the normalization criterion will not be met. For cases where voters could vote against all lists, NOTA votes should be equated with votes for parties, that is, in this case \(m\) is the number of parties participating in the election plus one, and \(p_m\) is the proportion of votes against all lists. At the same time, \(s_{ij}\) can be calculated both as a fraction of the number of valid ballots and as a fraction of the number of voters who voted. Our inspection indicated that for the 2016 State Duma election, the difference in the index value calculated by both methods amounted to 0.001 or less for all but one region, where it reached 0.003.
The proposed formula is universal. It can be used to assess territorial homogeneity of the vote not only for parties, but also for candidates, and not only on a national scale, but almost anywhere else. Therefore, we will shall refer to the index I as the index of territorial homogeneity of voting (ITOG).
We have to point out that this way would make it even easier to calculate the index of territorial heterogeneity of voting: in this case, we would not have to subtract the quotient from one, and the resulting index would have the value 1 in the case of absolute heterogeneity of voting and the value 0 in the case of absolute homogeneity. However, for results comparability, we prefer to calculate an index of territorial homogeneity of voting that similar to the index of party system nationalization.
Index of Territorial Homogeneity of Vote Returns for the Whole of the Russian Federation (Nationalization Index)
We calculated an index of territorial homogeneity of voting for the Russian Federation as a whole for the federal elections that took place between 1995 and 2021 (\(ITOG_{RF}\)). In the 2007 and 2011 presidential and State Duma elections, which were held under proportional representation system, regions acted as territorial units. For the 1995, 1999, 2003, 2016, and 2021 State Duma elections held under mixed system, we calculated \(ITOG_{RF}\) for regions and single-seat constituencies individually. The results are summarized in Table 1. As can be seen, there is little difference between index values for these two sections.
Table 1. Territorial homogeneity of voting index values for the Russian Federation in the federal elections of 1995–2021
| Election | Number of item | ITOG in context of | |
| regions | constituencies | ||
| 1995 State Duma | 44 | 0.750 | 0.741 |
| 1996 presidential election, 1st round | 11 | 0.876 | — |
| 1996 presidential election, 2nd round | 3 | 0.931 | — |
| 1999 State Duma | 27 | 0.800 | 0.790 |
| 2000 presidential election | 12 | 0.895 | — |
| 2003 State Duma | 24 | 0.865 | 0.855 |
| 2004 presidential election | 7 | 0.940 | — |
| 2007 State Duma | 11 | 0.921 | — |
| 2008 presidential election | 4 | 0.961 | — |
| 2011 State Duma | 7 | 0.872 | — |
| 2012 presidential election | 5 | 0.942 | — |
| 2016 State Duma | 14 | 0.877 | 0.879 |
| 2018 presidential election | 8 | 0.965 | — |
| 2021 State Duma | 14 | 0.867 | 0.878 |
Golosov and Grigoryev made similar calculations for the 1993-2011 State Duma elections [5], and our results match. For the 1993 elections, the nationalization index amounted to 0.80. The authors of the cited work noted that the index decreased in 1995 compared to 1993, then it grew until 2007 and slightly decreased in 2011.
Now we see that in 2016, the index slightly increased compared to 2011, and in 2021 in regions dropped to a level similar in 2003. In general, however, its values in 2003, 2011, 2016 and 2021 were close (0.86-0.88). As for presidential elections, in their case the index is mostly higher and at the same time always higher than for the same-cycle Duma elections.
It came to our attention that our index values are strongly related to the number of items on the ballot offered to a voter (the number of candidates or parties plus the NOTA vote if it is available). The test showed that the correlation between index values in regions and the number of items is quite high, with the correlation coefficient amounting to -0.903. This is because the overall index is the sum of the weighted indices for each item.
Nevertheless, this dependence is not absolute. We see here that the index peaked in the 2018 presidential election, although there were more candidates than in 2004, 2008, and 2012, and in the 1996 second round as well. The 2021 State Duma election, too, had twice as many parties as in 2011, but the index was slightly lower. And the highest index value at a Duma election was recorded in 2007, although there were more parties participating than in 2011.
Knowing the specifics of all the Duma elections, we could assume that nationalization level would be minimal in 1999, when the government relied on the Fatherland – All Russia bloc in some regions, on the Unity (also unoficially known as "Medved") bloc in others, while in many regions CPRF retained leadership. However, taking cue from Golosov and Grigoryev, we see that nationalization index was higher in 1999 than in 1995. Perhaps the reduced number of parties played a role here, but it is unlikely to be the only contributing factor.
As was pointed out before, ITOG is the sum of indices calculated for all items weighted by the share of votes for them. Figure 1 shows the dynamics of nationalization indices of the five parties and their predecessors that participated in a large number of elections — CPRF, LDPR (called "Zhirinovsky Bloc" in 1999), Yabloko, United Russia (called "Medved" bloc in 1999) and A Just Russia (called "Rodina" bloc in 2003).
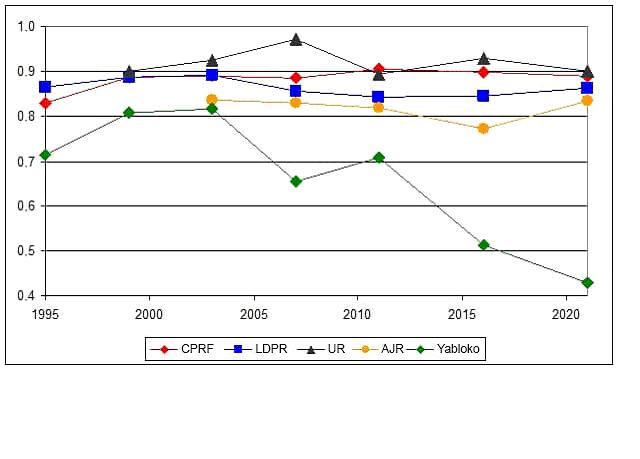
Figure 1. The dynamics of nationalization indices of the five major parties and their predecessors.
We can see that LDPR's nationalization index is quite stable, with a minimum in 2011 (0.843) and a maximum in 2003 (0.843). CPRF had a lower index in 1995 (0.830), and then it stayed in a narrow range (0.885-0.904). The index for Just Russia and its predecessor, Rodina (from 0.772 in 2016 to 0.837 in 2003), has lower, but also fairly stable values.
Medved bloc started with a fairly high nationalization index (0.899), while the Fatherland – All Russia bloc had an index of only 0.445. In 2003, United Russia's index had already reached 0.924, and in 2007 it rose to 0.972 (at that time, voting for the "party of power" was quite homogeneous). Then there was a decrease, especially substantial in 2011 (0.894) and 2021 (0.900), with some regions indicating rather low results (as low as 29.0% in Yaroslavl Oblast in 2011 and 25.3% in Khabarovsk Krai in 2021), and others very high (up to 99.5% in 2011 and 96.2% in 2021 in Chechnya).
Yabloko's nationalization index experienced an even stronger change. Gaining support mostly in large cities [Lyubarev 2019], this party initially had a low index (from 0.655 in 2007 to 0.817 in 2003). However, in 2016 there was a sharp drop (to 0.514), cemented in 2021 (0,428). Earlier, we pointed out that in 2016, Yabloko received 34.4% of all its votes in Moscow and St. Petersburg (the number stood at 27.0% in 2011 and at 28.9% in 2007) [10: 1084-1085]. In 2021, the figure increased even further, reaching 38.4%.
Analysis shows that the main parties (i.e. those that pass the threshold) have a fairly high nationalization index. Fatherland – All Russia bloc was the only exception in elections held between 1995 and 2021. In the 1993 elections, two of the parties that closed the Duma elections list had low indices as well: Party of Russian Unity and Accord (0.64) and the Democratic Party of Russia (0.46) [5].
At the same time, parties with low results may have quite low nationalization indices, but their contribution to the overall index is usually small. For example, in 1995, the Transformation of the Fatherland bloc headed by Sverdlovsk Oblast governor Eduard Rossel had the lowest index (0.048) and gained 12.1% in this region, while in Russia as a whole it only gained 0.5%. In 1999, it was another bloc from Sverdlovsk Oblast ("Mir. Trud. Mai" or "Peace. Labour. May" in Rus.) that indicated the lowest index (0.265; 0.6% in Russia, 5.9% in the region). In 2003, the Great Russia – Eurasian Union bloc had the lowest index (0.045; 0.3% in Russia, 20.7% in Ingushetia). Yabloko had the lowest index in 2007 and 2011, and Patriots of Russia (0.399) in 2016. In 2021, Rodina indicated the lowest index (0.354; 0.8% in Russia, 10.5% in Tambov Oblast).
Index of Territorial Homogeneity of Voting Results in Federal Elections in the Context of Federal Subjects
Now, let us come down to regional level. We calculated indices of territorial homogeneity of voting (ITOG) for all regions in the 1995-2021 State Duma elections in the context of territorial election commissions (with the exception of Nenets Autonomous Okrug, which only has two TECs). Since some regions merged between 2003 and 2008, for the elections of 1995-2007, we also calculated ITOG for the future merged regions (Zabaykalsky Krai, Kamchatka Krai, Perm Krai and united Krasnoyarsk Krai, united Irkutsk Oblast). For the elections of 2007-2021, we also calculated ITOG for regions that no longer exist (Krasnoyarsk Krai and Irkutsk Oblast without autonomous okrugs, Kamchatka Oblast, Perm Oblast, Chita Oblast, Komi-Permyak and Ust-Ordyn Buryat Autonomous Okrugs; we did not do calculations for Aginsk Buryat, Koryak, Taymyr and Evenki Okrugs because of the small number of TECs).
We had to make a significant adjustment for Moscow in the 2021 election. Here, a significant portion of voters (about half) voted by means of remote e-voting, and the results were significantly different from those of voting at polling stations (in particular, United Russia received 29.4% at regular polling stations and 44.8% through remote e-voting). All voters in a single-seat constituency (there are 15 in Moscow) were assigned to one of the TECs in that constituency. As a result, the returns for the territories were greatly skewed. Based on the unadjusted vote returns, ITOG calculation yielded an index value of 0.958. However, when we excluded remote e-voting sites from the calculation, we obtained a value of 0.970, which is more consistent with the values of this index in previous campaigns.
The calculation results are presented in Table 2. Minimum and maximum values for each election and the median values of the index (for 84 current regions, excluding Nenets AO) are also included in the table.
Table 2. Values of the index of territorial homogeneity of voting for Russian regions in the 1995-2021 State Duma elections
| Region | 1995 | 1999 | 2003 | 2007 | 2011 | 2016 | 2021 |
| Adygea Republic | 0.855 | 0.888 | 0.835 | 0.915 | 0.906 | 0.897 | 0.886 |
| Altai Republic | 0.857 | 0.923 | 0.846 | 0.950 | 0.934 | 0.921 | 0.942 |
| Republic of Bashkortostan | 0.758 | 0.798 | 0.886 | 0.932 | 0.923 | 0.886 | 0.902 |
| Republic of Buryatia | 0.848 | 0.900 | 0.891 | 0.937 | 0.934 | 0.912 | 0.917 |
| Republic of Dagestan | 0.682 | 0.809 | 0.798 | 0.971 | 0.973 | 0.933 | 0.917 |
| Republic of Ingushetia | 0.647 | 0.955 | 0.783 | 0.993 | 0.978 | 0.977 | 0.977 |
| Kabardino-Balkar Republic | 0.721 | 0.821 | 0.872 | 0.976 | 0.966 | 0.995 | 0.991 |
| Republic of Kalmykia | 0.764 | 0.906 | 0.935 | 0.942 | 0.921 | 0.890 | 0.929 |
| Karachay-Cherkess Republic | 0.772 | 0.844 | 0.814 | 0.947 | 0.948 | 0.953 | 0.988 |
| Republic of Karelia | 0.922 | 0.923 | 0.957 | 0.963 | 0.948 | 0.946 | 0.941 |
| Komi Republic | 0.885 | 0.907 | 0.933 | 0.972 | 0.945 | 0.961 | 0.971 |
| Republic of Crimea | — | — | — | — | — | 0.976 | 0.972 |
| Mari El Republic | 0.868 | 0.912 | 0.925 | 0.925 | 0.858 | 0.946 | 0.950 |
| Republic of Mordovia | 0.828 | 0.873 | 0.884 | 0.962 | 0.940 | 0.950 | 0.918 |
| Sakha Republic (Yakutia) | 0.792 | 0.863 | 0.854 | 0.920 | 0.919 | 0.899 | 0.923 |
| Republic of North Ossetia–Alania | 0.849 | 0.858 | 0.865 | 0.949 | 0.939 | 0.960 | 0.971 |
| Republic of Tatarstan | 0.750 | 0.754 | 0.807 | 0.903 | 0.877 | 0.913 | 0.951 |
| Tuva Republic | 0.708 | 0.907 | 0.912 | 0.963 | 0.930 | 0.910 | 0.921 |
| Udmurt Republic | 0.825 | 0.918 | 0.884 | 0.928 | 0.927 | 0.905 | 0.947 |
The table is not fully displayed Show table
* For the elections of 1995-2003 (and also for the 2007 elections for Zabaykalsky Krai and Irkutsk Oblast), the indices were calculated based on aggregate data for the regions that later merged with others.
** For the 2011-2021 elections (and also for the 2007 elections for Krasnoyarsk Krai, Kamchatka and Perm Oblasts and Komi-Permyak Autonomous Okrug), indices were calculated based on data from TECs that were previously part of these regions.
As we can see, the minimum, median and maximum values have the same trend as the nationalization index values described in the previous section. They were lowest in 1995, the minimum and median values were highest in 2007, but the maximum in 2011 was slightly higher than in 2007.
The minimum in 1995 and 2003 was in the Republic of Ingushetia, in 1999 in the Republic of Tatarstan, in 2007, 2011 and 2016 in the southern part of Tyumen Oblast, and in 2021 in Voronezh Oblast. The maximum was reached in Moscow in 1995, in St. Petersburg in 1999, in Ust-Ordynsky Buryat Autonomous Okrug in 2003, in Chechen Republic in 2007 and 2011, and in the Republic of Kabardino-Balkaria in 2016 and 2021.
To simplify the analysis and to eliminate the temporal factor, we calculated the ranks of regions among the currently existing regions presented in Table 2 (there were 81 regions in 1995 and 1999, 82 in 2003, 2007, and 2011, 84 in 2016 and 2021). These ranks are displayed in Table 3.
Table 3. Russian regions ranked according to values of the index of territorial homogeneity of voting in the 1995–2021 State Duma elections
| Region | 1995 | 1999 | 2003 | 2007 | 2011 | 2016 | 2021 |
| Adygea Republic | 33 | 26 | 5 | 3 | 7 | 6 | 6 |
| Altai Republic | 36 | 61 | 6 | 28 | 28 | 24 | 41 |
| Republic of Bashkortostan | 6 | 2 | 18 | 8 | 17 | 3 | 10 |
| Republic of Buryatia | 27 | 32 | 21 | 9 | 27 | 18 | 15 |
| Republic of Dagestan | 2 | 3 | 2 | 65 | 79 | 35 | 16 |
| Republic of Ingushetia | 1 | 79 | 1 | 81 | 80 | 81 | 80 |
| Kabardino-Balkar Republic | 4 | 4 | 12 | 76 | 75 | 84 | 84 |
| Republic of Kalmykia | 7 | 41 | 62 | 15 | 15 | 4 | 28 |
| Karachay-Cherkess Republic | 8 | 5 | 4 | 22 | 48 | 59 | 82 |
| Republic of Karelia | 78 | 59 | 79 | 53 | 47 | 50 | 40 |
| Komi Republic | 55 | 43 | 55 | 69 | 41 | 71 | 74 |
| Republic of Crimea | — | — | — | — | — | 80 | 77 |
| Mari El Republic | 43 | 49 | 43 | 5 | 2 | 51 | 48 |
| Republic of Mordovia | 20 | 18 | 16 | 50 | 32 | 57 | 18 |
| Sakha Republic (Yakutia) | 9 | 12 | 7 | 4 | 12 | 7 | 25 |
| Republic of North Ossetia–Alania | 28 | 7 | 9 | 24 | 31 | 70 | 75 |
| Republic of Tatarstan | 5 | 1 | 3 | 2 | 3 | 19 | 51 |
| Tuva Republic | 3 | 44 | 35 | 55 | 26 | 17 | 22 |
| Udmurt Republic | 17 | 55 | 17 | 6 | 21 | 13 | 47 |
The table is not fully displayed Show table
* For the elections of 1995-2003 (and also for the 2007 elections for Zabaykalsky Krai and Irkutsk Oblast), the indices were calculated based on aggregate data for the regions that later merged with others.
For our next step, it makes sense to identify regions with relatively stable rank values. The following regions indicate the smallest difference between the maximum and minimum rank values: Nizhny Novgorod Oblast (difference 14; average rank value 13.4), Bashkortostan (16; 9.1), Yakutia (21; 10.9), Buryatia (23; 21.3), Saratov Oblast (25; 17.4) representing territorially heterogeneous regions; Smolensk Oblast (22; 49.3), Volgograd Oblast (25; 44.1) representing balanced regions; Pskov Oblast (11; 72.3), Kurgan Oblast (18; 66.9), Leningrad Oblast (23; 69.7) representing territorially homogeneous regions.
At the same time, sharp changes in rank are characteristic of a number of republics. As we noted earlier, Ingushetia had the lowest index in 1995 and 2003, but in 1999 and in 2007-2021 its index was one of the highest. Kabardino-Balkar Republic was among the most heterogeneous regions in 1995-2003, and among the most homogeneous regions in 2007-2021 (in 2016 and 2021, it had the highest index). Similar "threshing" is characteristic of Dagestan, North Ossetia, Karachay-Cherkessia and Chechen Republics, as well as all three autonomous okrugs under consideration. Among the oblasts, the strongest changes in rank (a difference of more than 60) were observed in the Arkhangelsk, Astrakhan, Vladimir, Voronezh, Kemerovo, Lipetsk, Magadan, Omsk, Tambov, and Tyumen Oblasts.
Index of Territorial Homogeneity of Vote Returns in Russian Regions in Regional Parliamentary Elections
Assessment for the indices of territorial homogeneity of voting in regional parliamentary elections was made for the period between 2016 and 2020. For this assessment, we chose 28 regions, where the summary tables found on the CEC [17] portal included data on territorial election commissions. In addition, we picked Chelyabinsk Oblast where the summary table included data on precinct election commissions, but we organized the data on territorial commissions from the summary tables of precinct commissions.
Calculation results are presented in Table 4 in comparison with similar indices for the 2016 and 2021 State Duma elections. We would like to point out that in most cases, summary tables contained a greater number of items than the number of territorial commissions, since quite often the territory of a city or district corresponding to a commission was divided between different single-seat constituencies. In such a case, the summary table usually indicated territorial commission protocols for each individual constituency (exceptions included the republics of Kabardino-Balkaria, Kalmykia, Karachay-Cherkessia, North Ossetia and Tatarstan). However, for the purposes of proper comparison with the corresponding indices for the elections to the State Duma, we identified the total data for each territory and calculated the indices on the basis of this summarized data in all of the cases. At the same time, the difference with indices calculated on the basis of full summary tables was mostly small: the largest differences (0.011) in Bryansk and Kaluga Oblasts and Khanty-Mansi Autonomous Okrug, less than 0.005 in nine regions. The index for the reduced variant was greater in 14 regions and less in 9. For Chelyabinsk Oblast, the index was calculated in three variants: by constituent commissions (0.929), by protocols of territorial commissions for each constituency (0.902) and by summarized data for each territorial commission (0.920).
Table 4. A comparison of ITOG values for certain Russian regions in the 2006–2020 regional parliamentary elections against the 2016 and 2021 State Duma elections
| Region | Year of regional election | Regional election | State Duma | |
| 2016 | 2021 | |||
| Republic of Dagestan | 2016 | 0.795 | 0.933 | 0.917 |
| Kabardino-Balkar Republic | 2019 | 0.998 | 0.995 | 0.991 |
| Republic of Kalmykia | 2018 | 0.874 | 0.890 | 0.929 |
| Karachay-Cherkess Republic | 2019 | 0.961 | 0.953 | 0.988 |
| Komi Republic | 2020 | 0.929 | 0.961 | 0.971 |
| Sakha Republic (Yakutia) | 2018 | 0.901 | 0.899 | 0.923 |
| Republic of North Ossetia–Alania | 2017 | 0.866 | 0.960 | 0.971 |
| Republic of Tatarstan | 2019 | 0.924 | 0.913 | 0.951 |
| Tuva Republic | 2019 | 0.937 | 0.910 | 0.921 |
| Udmurt Republic | 2017 | 0.933 | 0.905 | 0.947 |
| Republic of Khakassia | 2018 | 0.946 | 0.952 | 0.976 |
| Zabaikalsky Krai | 2018 | 0.909 | 0.947 | 0.952 |
| Krasnoyarsk Krai | 2016 | 0.888 | 0.906 | 0.919 |
| Khabarovsk Krai | 2019 | 0.936 | 0.943 | 0.946 |
| Belgorod Oblast | 2020 | 0.907 | 0.901 | 0.905 |
| Bryansk Oblast | 2019 | 0.933 | 0.931 | 0.937 |
| Vladimir Oblast | 2018 | 0.965 | 0.914 | 0.976 |
| Volgograd Oblast | 2019 | 0.935 | 0.943 | 0.954 |
The table is not fully displayed Show table
The most interesting case is a comparison of indices obtained for regional and federal elections. This is particularly relevant for the 2016 elections that took place at the same time. The table shows seven regions where regional parliamentary election was held in September 2016 at the same time as the Duma election. Out of the seven, four regions (Kirov, Sverdlovsk and Tver Oblasts, and Khanty-Mansi Autonomous Okrug) indicated the difference between the indices as no more than 0.01 (in all of them the index for regional elections was higher than for federal elections, which may be connected with the smaller number of parties participating in regional elections). Krasnoyarsk Krai indicated a slightly bigger difference (the index for regional elections is lower by 0.018) and Kursk Oblast (the index for regional elections is higher by 0.016).
The Republic of Dagestan stands apart. We have previously pointed out the fact that in this region, the results dispersion in the 2007, 2011, and 2016 People's Assembly elections was much greater than in the State Duma elections of the same years (in 2007 and 2011, elections were held 9 months apart, while in 2016 they were held simultaneously) [12: 292-299]. In 2016 specifically, United Russia's results in the Duma elections ranged from 65.3% to 98.5%. In the People's Assembly elections, the party's results ranged from 1.4% to 96.6%. This phenomenon also manifested in ITOG values: while in the Duma elections the republic showed an ITOG close to the median (0.933), People's Assembly elections indicated a significantly lower ITOG (0.795).
It makes sense to compare the indices for the 2017-2020 regional elections with the indexes for both the 2016 and 2021 Duma elections. We can observe that in 8 regions (Karachay-Cherkessia, Yakutia, Tatarstan, Udmurtia, Bryansk Oblast, Vladimir Oblast, Ivanovo Oblast and Magadan Oblast) the index values for regional elections were between the values for the 2016 and 2021 Duma elections, with both differences being mostly small (exceptions include Vladimir and Magadan Oblasts). Four regions (Kabardino-Balkar Republic, Tuva Republic, Belgorod and Penza Oblasts) have a higher index for regional elections than for the two Duma elections, while ten regions (Kalmykia, Komi, North Ossetia, Khakassia, Zabaykalsky and Khabarovsk Krais, Volgograd, Kaluga, Kostroma and Chelyabinsk Oblasts) have a lower index.
The difference is the strongest in Republic of North Ossetia–Alania. In the 2016 and 2021 Duma elections, the republic was among the regions with the most homogeneous voting (ranking at 70 and 75 respectively, index values of 0.960 and 0.971). In regional elections on the other hand, like Dagestan, North Ossetia indicates a high degree of heterogeneity, as evidenced by ITOG value of 0.866.
Discussion
As was noted by Rostislav F. Turovsky [16], there are two aspects to researching territorial homogeneity or heterogeneity of vote returns (including nationalization): that of electoral geography and that of political foundation of party systems. The main aspect of our work is electoral geography that stems from an attempt to understand how strong the differences in vote returns in different territories are and what causes these differences.
Taking cue from Grigory Golosov, we decided to use an index based on the same approaches as the Herfindahl-Hirschman concentration index (that is, based on the standard deviation). This indicator (which we call ITOG) has a reliable theoretical foundation and is simple enough to calculate [4; 6; 5]. The results obtained in this article confirm its efficacy. We can see that our index is not too sensitive to variations in territorial division: this is evidenced by the close values of both the national index in the context of regions and single-seat districts and regional indices when the number of territorial units changes.
On the other hand, the index shows sufficient sensitivity to changes in vote returns by territory. This can be seen both on the example of Moscow in the 2021 Duma elections (where the changes, although fabricated, were manifested quite clearly), and in the analysis of index dynamics. At the same time, the case of regions indicates that the index values are quite stable in some of them, while in others they vary greatly, and these variations reflect the changes in the electoral geography of the region.
Our results allow us to compare the degree of heterogeneity of vote returns across the country (in the context of regions) and across regions (in the context of territorial units). Back in 2005, Rostislav Turovsky wrote that the "vertical" split of "center–periphery" is much more pronounced in Russia than the "horizontal" splits between large territorial communities [15]. The ITOG values we obtained, however, show that inter-regional differences are generally more pronounced than intra-regional ones. A comparison of the data presented in Tables 1 and 2 shows that in all the Duma elections, the federal index is lower than the median value of regional indices. Nevertheless, there were regions with an ITOG lower than the federal total in all campaigns (except 2021). The largest number of such regions (9) was identified in 2003.
The dynamics of the nationalization index in Russia were discussed in detail by Grigory Golosov and V.S. Grigoryev [5]. They noted that despite the weak development of the party system, voting by party list has consistently demonstrated a fairly high level of nationalization, even compared to stable democracies.
The authors of the work in reference came to a conclusion that the low level of development of the party system and authoritarian tendencies do not necessarily prevent nationalization. Moreover, it was the weakness of the parties at the local level and at the same time the strong influence of national media (primarily television) that contributed to the homogeneity of vote returns nationwide. The following factors further reinforced the state of affairs: temporal closeness of the Duma and presidential campaigns (which strengthened the role of the federal agenda in the Duma campaigns), the lack of real federalism (including the ban on the creation of regional parties that has been in effect since 2001), and the leading role of gubernatorial political machines in securing votes for the monopoly pro-government party in federal and regional elections.
Intra-regional differences in vote returns have been investigated to a lesser extent. Yury Gaivoronsky calculated the Jones-Meanwaring index for federal subjects in the federal and regional elections of 2012-2018, but did not provide complete results [3].
This paper provides an integral assessment of such differences for the first time. Table 2 show both the ITOGs for all Russian regions (except for small autonomous okrugs) and their dynamics.
What are the factors that influence the degree of homogeneity or heterogeneity of voting? We believe that these factors can be divided into three groups: 1) factors related to territorial division of the regions; 2) factors related to the socio-economic, historical and ethnic differences of the territories; 3) factors related to the use of administrative resource. Let us take a closer look at these factors.
When discussing the territorial division, the first thing to check is whether the number of territorial units affects the index (below is the number of units in the "average" 2003). With confidence, we can say that it does not. We see high index values both in regions with a small number of territorial units, like Republic of Karelia (19), Republica of Khakasia (13), Kaliningrad Oblast (23), Magadan Oblast (10), Murmansk Oblast (19), Jewish Autonomous Oblast (6) as well as in the mega regions like Moscow (121) and Moscow Oblast (75). Low index values can also be seen both in small regions (Adygea Republic (9), Republic of Kalmykia (14), Astrakhan Oblast (16), Belgorod Oblast (22), the southern part of the Tyumen Oblast (28)) as well as mega regions (Republic of Tatarstan (63), Krasnoyarsk Krai (67), Nizhny Novgorod Oblast (61) and Sverdlovsk Oblast (78)).
Given the strong differences in vote returns in the regional center and in the periphery [11], one could assume that the index values would be affected by how many territorial units are represented by the regional center. For example, Kostroma is represented by one unit and Kirov by four, Belgorod by one unit, and Kursk by three. One would expect that the smaller the number of units represented by a regional center, the smaller its contribution to voting heterogeneity, meaning that homogeneity index should have been higher. However, Kirov and Kostroma Oblasts indicate close index values, and Belgorod Oblast shows greater heterogeneity than Kursk Oblast.
Beides, given the differences in voting in urban and rural areas, it could have been assumed that greater homogeneity would have manifested in regions where rural areas are mostly administratively incorporated into cities. Saratov Oblast is an example of such regions, but it has low index values anyway.
Therefore, factors of the first type do not seem to have a strong influence on the index we are calculating. And this is evidence in favor of its use.
The most interesting second-type factor is the share of the urban population according to Rosstat (Russia's Federal State Statistics Service) [2]. It turned out that in 1995 and 2003, our index had a fairly good correlation with the share of urban population in the regions on January 1, 1996 and January 1, 2004, respectively. (0.53 and 0.49 respectively). In 1999, the correlation was much worse (0.20), and there has been virtually no correlation since 2007 (coefficients less than 0.1). This seems to be linked to a sharp increase in the indices in a number of republics where the share of the urban population is quite low.
If we look at the 1995-2003 elections, Table 3 clearly shows that all 10 republics had their indices in the lower half, which means they were largely heterogeneous. In Chechen Republic, the index could only be calculated for 2003, and it was low at that time as well. Another five republics had relatively high indices in 1999 and low indices in 1995 and 2003. Kalmykia's index was low in 1995, medium in 1999, and relatively high in 2003. And only four republics (Karelia, Komi, Mari El, and Khakassia) had relatively high indices in all three election campaigns.
In 2007, the index values of Dagestan, Ingushetia, Kabardino-Balkaria and Chechnya indicated a sharp increase; Mordovia and Tyva also experienced a significant shift towards greater homogeneity, and Karachay-Cherkessia followed in 2011. As was pointed out by Turovsky [Turovsky 2016], the ethnic regionalism in peripheries gave way to deliberately extreme loyalty to the center. In 2016 and 2021, Adygea, Bashkortostan, Buryatia, Kalmykia, Yakutia, and Tuva showed the greatest heterogeneity in voting among the republics.
Note that most republics are characterized by both ethnic heterogeneity and a high proportion of the rural population, with a higher proportion of titular ethnic groups in rural areas. Therefore, for the republics, we could expect significant heterogeneity in vote returns, and the high homogeneity that some republics began to show since 2007 is perceived as an anomaly.
Among the regions that invariably or often indicated strong voting heterogeneity, we also mostly see regions where large industrial centers and large rural peripheries go hand in hand, like Voronezh, Nizhny Novgorod, Rostov, Samara, and Saratov Oblasts. The south of Tyumen Oblast stands out a little — it showed sufficient homogeneity in 2003, and then took the lead in heterogeneity for three consecutive campaigns.
On the other hand, high voting homogeneity in Moscow and St. Petersburg as well as in center-less Leningrad and Moscow Oblasts does not come as a surprise. The same can be said about high voting homogeneity in small regions with relatively small regional centers: Republic of Khakassia, Amur Oblast, Vologda Oblast, Kurgan Oblast, Novgorod Oblast, Pskov Oblasts and Jewish Autonomous Oblast.
Factors of the first and second type are long-term in nature, so it is difficult to use them to explain sharp transitions of regions from being electorally heterogeneous to homogeneous and vice versa. We believe that such transitions are a consequence of using administrative resource in one form or another — from specific choices being enforced by the elites to direct electoral fraud.
At the same time, administrative resource can have varying impact on the degree of voting homogeneity. If it mostly operates in rural periphery, where the electorate is more dependent and there is less control, it should result in greater heterogeneity of the vote. If administrative resource is so strong that it can determine vote returns in all the territories and tries to bring all the territories to the same indicators at the same time, heterogeneity of results turns excessive (0.990-0.999), like in Kabardino-Balkaria and Chechen Republics.
A good example is Moscow, where the 2011 Duma elections were accompanied by large-scale fraud that was hard to miss and therefore led to mass protests. In the previous elections in 2007, fraud level was markedly lower, and the 2011 protests eradicated fraud from Moscow for many years to come [12: 219-242]. Since fraud in Moscow was not widespread even in 2011, it markedly reduced the index of territorial homogeneity of voting. As shown in Table 2, Moscow index value dropped to 0.944 in 2011, which is 0.02 lower than in 2016 and 0.027 lower than in 2007. The difference is even clearer in Table 3: Moscow's ranking in all years except 2007 and 2011 was no lower than 73, but it dropped to 66 in 2007, and to 36 in 2011.
In this connection, there is an evident fact that in 2021, a number of regions (Kamchatka, Krasnodar, Primorsky and Stavropol Krais, Moscow, Ryazan, Sakhalin and Tula Oblasts, St. Petersburg, Khanty-Mansi Autonomous Okrug and Chukotka Autonomous Okrug) indicated a sharp decrease in the index rank compared to previous campaigns. Each case requires individual examination, but all in all this fact agrees with Shpilkin's conclusion about the increased share of "anomalous" votes in 2021 compared to 2016 [14].
Thus, indices of territorial homogeneity of voting can be used to detect anomalies in vote returns.
Received 08.11.2021, revision received 24.11.2021.
References
- Caramani D. The Nationalization of Politics: The Formation of National Electorates and Party Systems in Western Europe. Cambridge: Cambridge University Press, 2004. 347 p.
- Dolya gorodskogo naseleniya v obshchei chislennosti naseleniya na 1 yanvarya [The Share of Urban Population in the Total Population as of January 1]. – Rosstat Website. URL: https://showdata.gks.ru/report/278932/ (accessed 07.11.2021). (In Russ.) - https://showdata.gks.ru/report/278932/
- Gaivoronsky Yu.O. Faktory natsionalizatsii partiynoi sistemy sovremennoi Rossii [Factors of Nationalization for the Modern Party System of Russia]. – POLIS. 2018. No. 1. P. 45–61. DOI: 10.17976/jpps/2018.01.04. (In Russ.)
- Golosov G.V. Factors of party system nationalization. – International political science review. 2016. Vol. 37. No. 2. P. 246–260. DOI: 10.1177/0192512114552864.
- Golosov G.V., Grigoryev V.S. Natsionalizatsiya partiynoy sistemy: rossiyskaya spetsifika [Party System Nationalization in the Context of Russia]. – Politicheskaya nauka. 2015. No. 1. P. 128–156. (In Russ.)
- Golosov G.V. Party system nationalization. The problems of measurements with an application to federal states. – Party politics. 2014. Vol. 22. No.3. P. 278–288. DOI: 10.1177/1354068814549342.
- Grishin N.V. Dinamika elektoralnykh predpochteniy naseleniya Yuga Rossii: Sravnitelnoe issledovanie [The Dynamics of Electoral Preferences in the Russian South: A Comparative Study]. Moscow: Sotsialnopoliticheskaya MYSL, 2008. 182 p. (In Russ.)
- Grishin N.V. Territorialnye razlichiya elektoralnoi podderzhki KPRF na Yuge Rossii [Territorial Differences in Electoral Support for CPRF in the Russian South]. – Izvestiya vysshikh uchebnykh zavedeniy. Severo-Kavkazskiy region. Obshchestvennye nauki. 2006. No. 7. P. 33–39. (In Russ.)
- Korneyeva E.M. Lokalny uroven golosovaniya v Rossii: prostranstvenno-ekonometricheskiy podkhod [Local Voting Level in Russia: A Spacial and Econometric Approach]. – Politicheskaya nauka. 2021. No. 3. P. 229–250. DOI: 10.31249/poln/2021.03.10. (In Russ.)
- Kynev A., Lyubarev A., Maksimov A. Kak vybirala Rossiya – 2016. Rezultaty monitoringa izbiratelnogo protsessa [The 2016 Russian election. Electoral Process Monitoring Results]. Moscow: Liberal Mission Foundation. 2017. 1142 p. (In Russ.)
- Lyubarev A.E. Intraregional Differences of Electoral Indices during the Elections in Russia in 1995–2018. – Electoral Politics. 2019. No. 1. P. 3. - http://electoralpolitics.org/en/articles/vnutriregionalnye-razlichiia-elektoralnykh-pokazatelei-na-rossiiskikh-vyborakh-1995-2018-gg/
- Lyubarev A.E. Zanimatelnaya elektoralnaya statistika [Entertaining Election Statistics]. M.: Golos Consulting, 2021. 304 p. (In Russ.)
- Podkolzina Ye.A., Demidova O.A., Kuletskaya L.Ye. Prostranstvennoe modelirovanie elektoralnykh predpochteniy v Rossiyskoy Federatsii [Spacial Modelling of Electoral Preferences in the Russian Federation]. – Prostranstvennaya ekonomika. 2020. Vol. 16. No. 2. P. 70–100. DOI: 10.14530/se.2020.2.070-100. (In Russ.)
- Shpilkin S. Vybory po nakatannoi koleye [Elections on a Beaten Trail]. – Troitsky variant – Nauka, 05.10.2021. No. 339. P. 1, 3. URL: https://trv-science.ru/2021/10/vybory-po-nakatannoi-kolee/ (accessed 08.11.2021). (In Russ.) - https://trv-science.ru/2021/10/vybory-po-nakatannoi-kolee/
- Turovsky R.F. Kontseptualnaya elektoralnaya karta postsovetskoi Rossii [Conceptual Electoral Map of Post-Soviet Russia]. – Politiya. 2005. No. 4 (39). P. 161–202. (In Russ.)
- Turovsky R.F. Natsionalizatsiya i regionalizatsiya partiynykh sistem: podkhody k issledovaniyu [Nationalization and Regionalization of Party Systems: Research Approaches]. – Politiya. 2016. No. 1 (80). P. 162–180. (In Russ.)
- Vybory, referendumy i inye formy pryamogo voleizyavleniya [Elections, Referendums and Other Forms of Direct Expression of Will]. – The CEC of Russia website. URL: http://www.vybory.izbirkom.ru/region/izbirkom (accessed 03.11.2021). (In Russ.) - http://www.vybory.izbirkom.ru/region/izbirkom