 Alexander Kireyev
Electoral geographer, alexkireev@gmail.com
Electoral Geography and Statistics as a Key to Understanding the Fairness of US Presidential Elections
Abstract
In this paper, the author analyses the statistics of the results, turnout and postal voting in the 2020 United States Presidential Election. The author argues that neither election statistics from the state, county and precinct levels, nor comparing this year's results to previous year's results (especially in competitive states) indicate any evidence of significant electoral fraud that would have benefited Joseph Biden.
The results of the 2020 US presidential election, where Joseph Biden was the winning candidate, were disputed by the losing candidate Donald Trump. Along with his team and supporters, Donald Trump presented numerous electoral fraud cases to contest the results of the election. However, all cases were either denied, dismissed, settled or withdrawn for lack of any substantial evidence, and both the Electoral College and Congress certified Biden's election win.
Unfortunately, it is physically impossible to study all of the alleged fraud evidence, as there was simply too much of it presented, enough to fill thousands of pages with text. In this paper, I will focus on the three main statistical aspects of this election: absence of geographic anomalies, Trump's (and not Biden's) positive correlation with turnout and postal voting statistics, which was targeted the most.
However, before I begin, I have to make two important reservations. First, when it comes to elections in the US, there are two notions that are often confused and used interchangeably: bad management and fraud. Unfortunately, bad electoral management is nothing new in the US, while fraud cases are actually relatively rare. There is much to be said about bad management, but there is one important reason that explains it and is crucial for understanding elections in the US. Election procedures differ greatly on all levels: state-wise, county-wise and and even in certain municipalities. It takes an immense amount of effort trying to understand all these nuances and rules: some of them are quite strange and were changed by the 2020 COVID-19 pandemic on top of everything else. In this paper, I will focus on the evidence of electoral fraud instead of the evidence of bad management, if not unfairness of electoral system in the USA.
The second reservation is that I cannot fully disprove the existence of small-scale fraud at smaller precincts with vote numbers ranging from dozens to hundreds: it is not statistically measurable and cannot be "traced" without a proper criminal investigation. I can only assert that the latest presidential election in the US did not have any major cases of fraud, and that Biden did win the election.
Lack of geographic anomalies
The most important evidence proving the lack of any major fraud cases in the 2020 US presidential election is the lack of geographic anomalies across both states and counties. Such anomalies would surely have been present had there been major cases of electoral fraud. In theory, it is naturally possible that somewhere, at a central office for fraud activity, there was a group of experienced electoral geographers that coordinated the level of fraud in different states, counties and precincts. Democrats, on the other hand, had to coordinate fraud activity in states and counties with Republican trifectas aside from the states with Democratic ones. Here is where we step into the territory of outright fanciful assumptions. That is, without even starting on how such a situation completely contradicts the fact of largely bad electoral management in the US – the fact neither party denies.
Let us take a look at the map presented in Figure 1 and Table 1 [25]. In fact, these two are enough to definitely rule out the assumption on the existence of major fraud cases in this election. The map and the table allow us to make several conclusions, the most important being that the vote gap between Democrats and Republicans has changed in favor of the former in all states but six as compared to 2016. Coincidentally, these six exceptions are easily explained. Elections in the US have repeatedly shown that Republican voters are largely white, while Democratic voters are largely represented by minorities. However, compared to 2016, Donald Trump happened to gain more ground among minorities in 2020. Proof is easily found by comparing the 2020 exit poll results [18] to the 2016 exit poll results [17]. Among African Americans, 8% voted for Trump in 2016 against 12% in 2020. Among Latino voters, 28% voted for Trump in 2016 against 32% in 2020. Among Asian Americans, the numbers are 27% and 32% in 2016 and 2020 respectively.
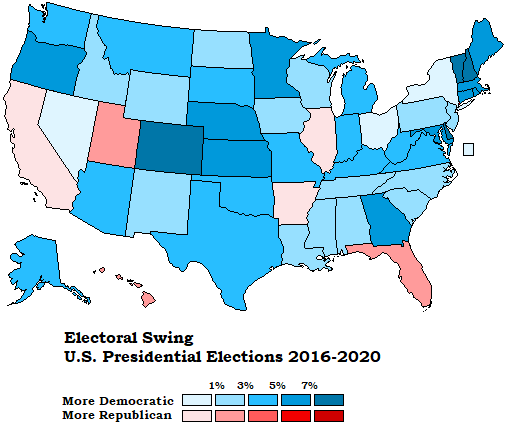
Figure 1. Vote shift in states in 2020 as contrasted with 2016 Source: https://cookpolitical.com/2020-national-popular-vote-tracker.
Hawaii indicated the largest differential – a 2.7% shift in Trump's favor. I have to point out that this record shift is still small. However, the majority of Hawaii's population is represented by minorities. Another fact is that Hawaii typically votes well for incumbents even if they are Republican. For instance, even George Bush got 45% in Hawaii in 2004 against 37.5% in 2000 [24].
Utah indicated a 2.4% shift. A Mormon Republican Evan McMullin ran for president in 2016, gaining 20% in Mormon-dominated Utah. In 2020, Trump simply got a share of his votes.
Florida indicated a 2.2% shift in Trump's favor. In this case, the shift was largely driven by Cuban natives, who gave Trump 22% in Miami-Dade – a county densely populated by them. Florida does have a high percentage of other minorities, however.
California indicated a shift as low as 0.9%. This case is easily explained as well, as it was driven by a large percentage of Latin and Asian Americans who shifted in Trump's favor.
Arkansas indicated a 0.7% shift. In 2016, the vote was swayed towards Hillary Clinton partially because of Bill Clinton's being a native of Arkansas.
Last but not least, Illinois indicated a 0.1% shift in Trump's favor. This figure is, of course, minuscule, and largely driven by minorities in Chicago. Also, we have to remember that Hillary Clinton's success in 2016 can be partially explained by her being a native of Illinois.
All other states indicated a shift in favor of Biden. What is most important, the shift could be observed both in states officially led by Trump and states officially led by Biden, as well as both Democratic and Republican trifecta states. For example, Biden unexpectedly won Georgia, and by a whisker to boot. However, Georgia's state government is under Republican control. The head of the state's executive branch is a Republican. The secretary of state, who is also responsible for elections, is a Republican. Republicans hold the majority in the state legislature – Georgia General Assembly. What is more, eight out of nine Supreme Court Justices were appointed by a Republican governor.
Table 1. Vote shift in competitive and noncompetitive states in 2020 as contrasted with 2016
| State | Share | Margin Shift vs. 2016 | ||
| Biden | Trump | Other | ||
| U.S. Total | 51.3% | 46.9% | 1.8% | 2.4% |
| 15 Key Battlegrounds | 48.4% | 50.1% | 1.4% | 2.0% |
| Non-Battlegrounds | 53.4% | 44.5% | 2.1% | 2.7% |
Source: https://cookpolitical.com/2020-national-popular-vote-tracker
Vote shifts in Biden's favor could be observed both in competitive and noncompetitive states, meaning both swing states that determine the outcome of an election and safe states that regularly lean to a single party in a landslide (and where presidential candidates do not even campaign in).
What we should really be focusing on is this: in competitive states, the shift in Biden's favor was even smaller than in noncompetitive ones. For example, Table 1 demonstrates that competitive states indicated a 2% shift in Biden's favor while noncompetitive states indicated a 2.7% shift. This means that compared to 2016, Biden was a bit more successful in noncompetitive stats than in competitive ones. If the goal of ballot-riggers had been to bring Joseph Biden to victory in the presidential election, would they have focused on rigging noncompetitive states more than competitive states? This means that shift patterns contradict the theory of major electoral fraud being committed in the 2020 election, yet fit the assertion that election results are valid.
We have to point out that vote shifts in states also contradict the view that Dominion Voting Systems equipment counted votes in Biden's favor. Dominion Voting Systems is a company that produces hardware and software for counting votes in elections in the US. However, not all states have contracts with the company. If Dominion had changed Trump's votes to Biden's votes, such states would have been visible in the shift. What we have instead is the opposite: non-Dominion states shifted in Biden's favor more than Dominion states [5] – see Table 2.
Table 2. The 2020 presidential election results in Dominion and non-Dominion states
| 2020 | 2016 | Difference | |
| States that use Dominion | |||
| Biden / Clinton | 52.7% | 49.7% | 3.0% |
| Trump | 45.6% | 44.5% | 1.1% |
| States that do not use Dominion | |||
| Biden / Clinton | 46.4% | 42.7% | 3.7% |
| Trump | 51.6% | 51.6% | 0.0% |
Source: https://www.dominionvoting.com/about/
Lack of geographic anomalies is obvious on county level as well. Compared to the 2016 election, nearly all major shifts are easily explained by the social and demographic characteristics of counties. Latino population indicated the most substantial shift in Trump's favor while other minorities indicated more subtle shifts. Rural areas indicated a more pronounced shift in Trump's favor. As for Biden, a more pronounced shift in his favor is found in suburbs, among college-educated White population.
Electoral fraud aimed at swaying the vote in Biden's favor would have definitely manifested as abnormally high results in certain counties. However, there are no such counties. Georgia's Henry County – Atlanta's south suburbs – indicated the most pronounced shift in Biden's favor in the country (16%). There is a clear explanation for it: the growing percentage of African American population in the county. According to the 2000 United States census, African Americans constituted 14.7% of the population. In 2019, the number went as high as 47.9% [11]. As for Non-Hispanic Whites, their percentage dropped from 55% in 2010 to 40% in 2019. A 16% shift is a historically small record shift for this county. Even Trump has over a dozen counties with a much more substantial shift in his favor as compared to the 2016 election. His record high of 55% was spotted in Starr County, Texas [23]. In fact, this shift in Trump's favor is not evidence of electoral fraud either, as it was mostly observed in sparsely populated rural counties and also highly locked in on Latino population.
Figure 2 shows the shift in Pennsylvania counties in comparison with 2016. Compared to Clinton, Biden has improved (albeit slightly) his stand in the entire densely populated Eastern Pennsylvania except for Philadelphia itself, which is expected, as it has a high percentage of African Americans. Trump has slightly improved his stand in rural heartland, but this area is sparsely populated. Biden has also improved his stand in Pittsburgh and slightly in Erie Counties [4; 12].
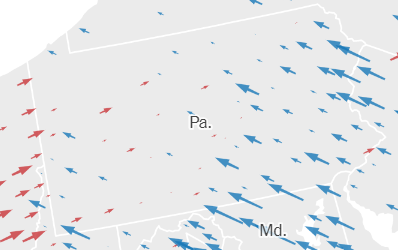
Figure 2. Vote shift in presidential election in Pennsylvania in 2020 as contrasted with 2016 Source: https://kireev.livejournal.com/1815333.html
But what if fraud cases were small and not visible on such maps? We have maps for precincts that show no indication of major electoral fraud either – and they would have, even if the level of fraud had been about 1% of the number of voters. We do have a reliable precedent, when even a relatively small fraud case could be seen on precinct and even county level. There was a relatively small but well-documented case of electoral fraud in the 2018 midterm election to Congress that was found in North Carolina's 9th congressional district. Voters in Bladen and Robeson Counties signed affidavits (written statement confirmed by oath) stating that someone was walking around collecting absentee ballots from voters, which is illegal. It turned out that Republican candidate Mark Harris Harris had hired independent contractors that went to voter's homes to illegally collect absentee ballots. As a result, these ballots that carried votes for Democrats were not delivered to the electoral commission, and Figure 3 and Table 3 clearly show that Democrat votes are missing in these two counties specifically [2; 22; 12]. And we are talking about less than a thousand of votes at that. However, the gap between candidates amounted to 900 votes, and the electoral commission refused to certify election results in this county, holding a revote instead.
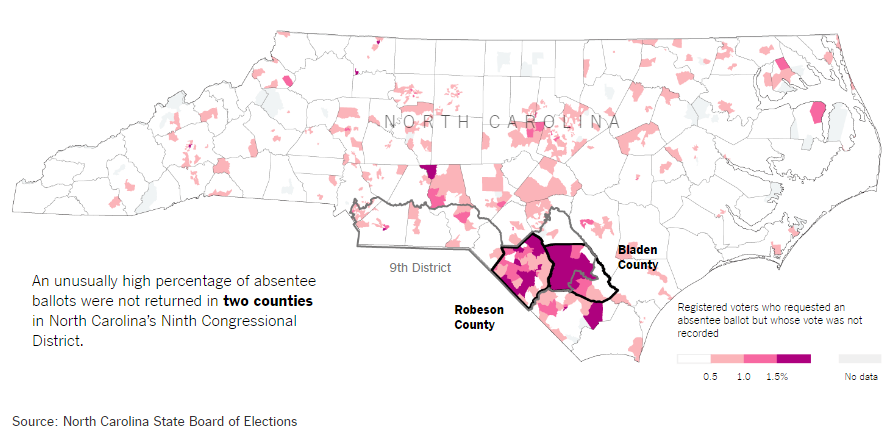
Figure 3. Share of registered voters, who applied for postal ballots, but did not return them to the electoral commission at the 2018 US Congress elections in North Carolina Source: https://kireev.livejournal.com/1815333.html
Table 3. 2018 North Carolina's 9th congressional district election results in counties
| County | 2016 | 2018 | Change |
| Union | R+36.4 | R+20.4 | D+16.0 |
| Bladen | R+16.4 | R+16.6 | R+0.2 |
| Meckelenberg | R+16.2 | D+9.3 | D+25.5 |
| Richmond | R+7.6 | D+2.0 | D+9.6 |
| Cumberland | R+1.6 | D+4.1 | D+5.7 |
| Robeson | D+4.2 | D+14.7 | D+10.5 |
| Scotland | D+9.2 | D+13.4 | D+4.2 |
| Anson | D+12.2 | D+16.4 | D+4.2 |
Source: https://twitter.com/NateSilver538/status/1068335913162481664
However, there are no such examples in the 2020 election. Never before had an electoral fraud case been so well-documented, and nowhere else had a geographic anomaly been so obvious on the precinct or county level.
There are many maps that show presidential election results in municipalities or precincts. However, none of them indicate any anomalies that would sway the vote in Biden's favor. Let us take the map of the results and the shift in Philadelphia suburbs broken down by townships. This case meets two necessary conditions: a competitive state and a significant shift in Biden's favor as compared to the 2016 results. These maps (see Figure 4) do not indicate any abnormally high results for Biden. In almost all townships, Biden has improved Clinton's numbers by a few percent. The red spot in the lower Bucks County is a university: there were no students there due to lockdown. The pink spots are the more active districts. The bright red spot in the the south of Chester County is Lower Oxford Township, where 35% of the population are African American and where Trump gained in quite a significant share of votes. The dark blue spot is the tiny Newlin Township – the heart of Chester County, where Biden gained the most as compared to Clinton (988 votes against an even smaller number in 2016). All shifts are subtle, and are supported by shift trends in other areas [3; 12].
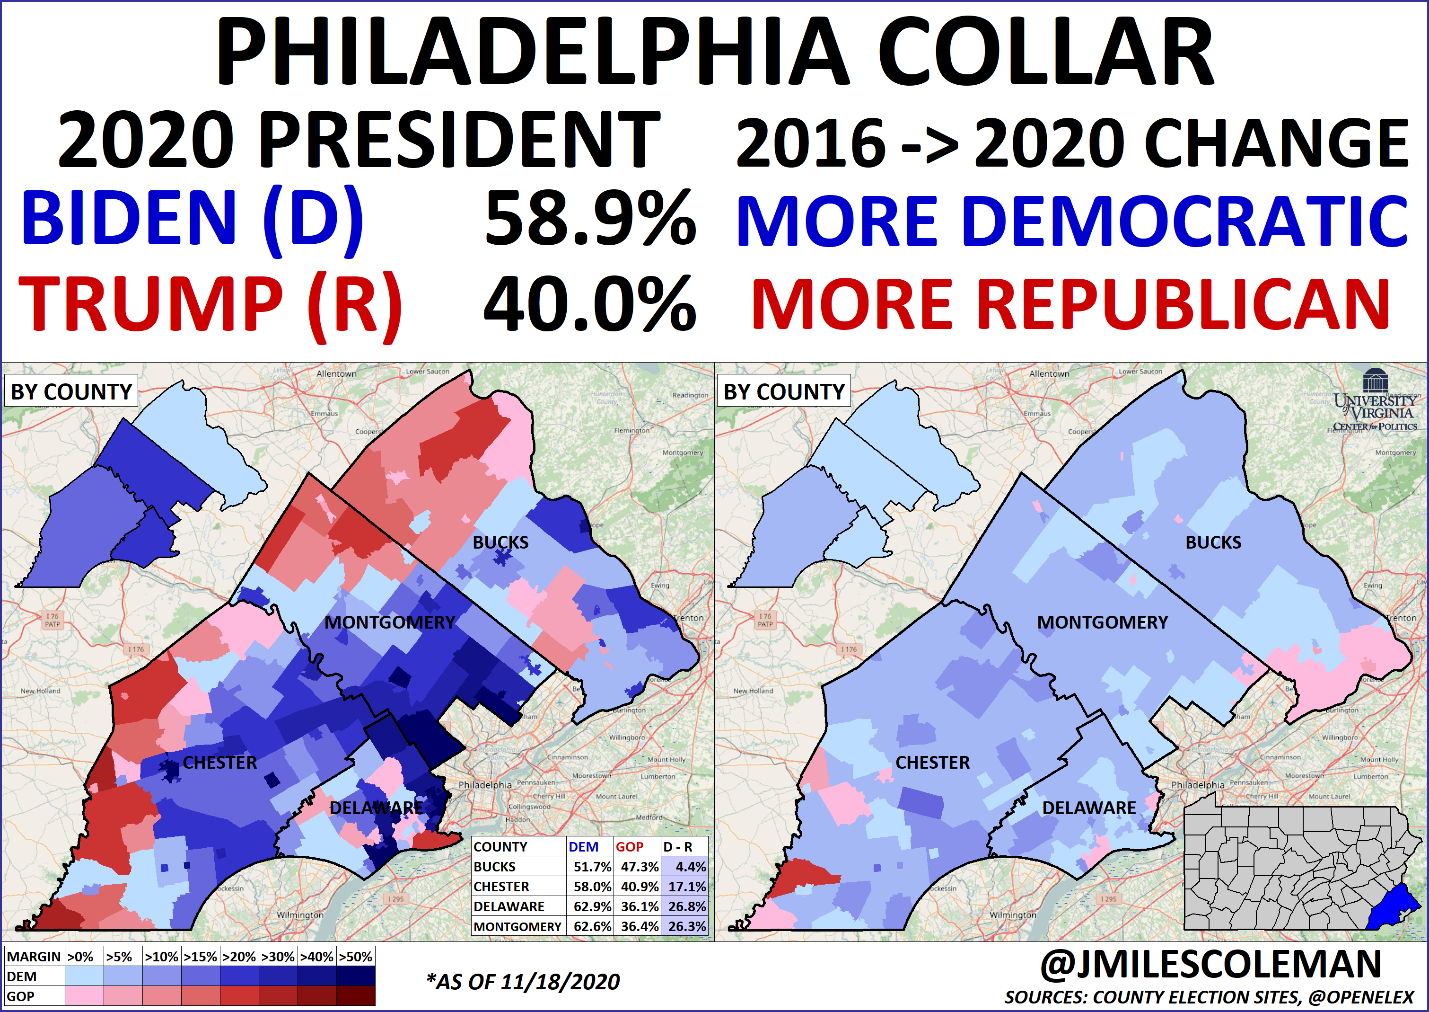
Figure 4. Results and shifts in the presidential elections of 2016 and 2020 broken down by Philadelphia townships. Source: https://kireev.livejournal.com/1815333.html
We can also make a comparison of the 2016 and 2020 election result maps in the Atlanta metropolitan area – see Figure 5. It is easy to notice that geographic pattern is unchanged, even though precinct zoning has in some cases, and Biden has gained in some votes in 2020, especially in the mostly White Republican suburbs north of Atlanta [10; 13].
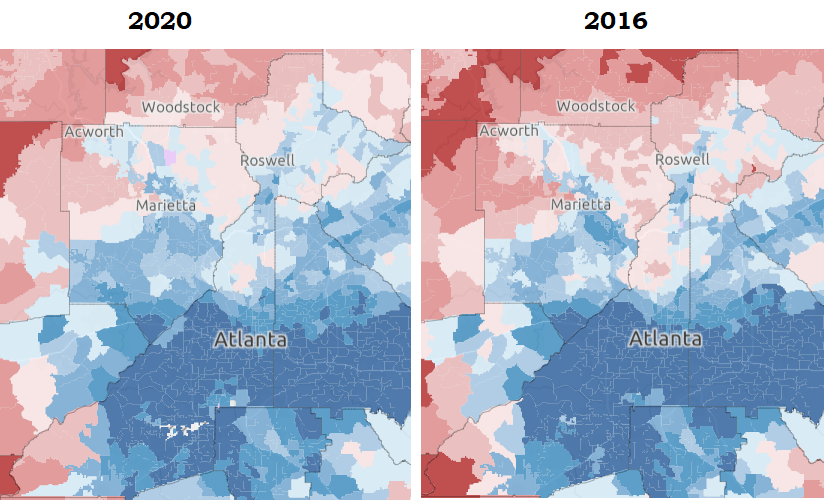
Figure 5. The 2020 presidential election results broken down by precincts in Atlanta metropolitan area Source: https://kireev.livejournal.com/1835610.html
Positive correlation of voter turnout with voting for Trump instead of Biden
A feature of electoral fraud taking place in elections in Russia was the strong correlation between turnout and voting for the "party of power", whether it is Putin or United Russia [14]. The turnout-vote correlation itself may occur naturally, yet in Russian elections, it first of all occurred wherever both turnout and pro-current government vote increased sharply. That said, both indicators stood out geographically from turnout and election results indicators in similar areas or even in neighboring precincts. For example, in the 2011 Russian legislative election, precincts in Moscow indicated a so-called "two-humped camel" – see Figure 6. Different colours on the graph indicate the number of precincts with certain turnout (horizontal axis) and United Russia's vote (vertical axis). Wherever there is red, there are many such precincts. Wherever there is blue, there are no such precincts whatsoever. For example, a turnout of 51% indicated 10 precinct election commissions (PEC) voting for United Russia with a 25% result. In a way, Moscow split in two parts. Loosely speaking, the "party of power" gets 25% with turnout at 50% in one part, and over 50% with turnout at 50-70% in the other. And there are few precincts between these parts. And the right side of the graph only has one clearly defined cloud. How does this happen? The explanation is obvious: we can clearly see the minority of precincts with actual results and turnout in the bottom of the first graph, and the majority of precincts with rigged results and turnout in the upper right part. During the 2012 election, fraud in Moscow effectively disappeared, and nearly all the spots merged into one cloud [20].
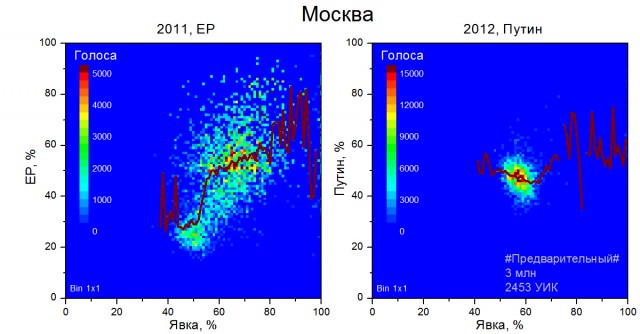
Figure 6. Vote returns for United Russia and V.V.Putin and turnout in Moscow precincts in the 2011 Russian legislative election and the 2012 President election. Source: https://oude-rus.livejournal.com/581302.html
This graph emerged on account of the fact that each ballot stuffed for United Russia raises the turnout by one vote as well. This is also what we should see in case there is any ballot stuffing in Biden's favor in the US presidential election. However, the situation in the US is quite different. It is Trump who has a positive correlation between votes and turnout, not Biden.
Unfortunately, one of the issues we encounter while analyzing presidential election results in the US is the country's lack of a centralized election body, like the Central Election Commission of the Russian Federation (the CEC of RF). The Federal Election Commission in the US performs a completely different set of functions, and elections are conducted and managed by each state individually. Moreover, certain counties are involved in election management as well. These factors make it very difficult to collect election results from precincts all over the country. However, it is possible to collect election results and turnout data based on competitive states. All of the most competitive states analyzed in this paper indicate a positive correlation between voting and turnout for Trump and negative correlation for Biden.
For example, Figure 7 is a graph displaying election results and turnout data in the counties in Pennsylvania [12]. Is there anything that would indicate ballot studding in Biden's favor? This image is a complete opposite of what could have been had the stuffing taken place.
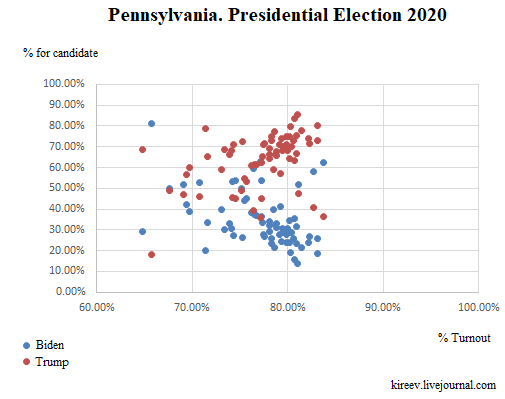
Figure 7. Election results and turnout in the 2020 presidential election broken down by counties in Pennsylvania. Source: https://kireev.livejournal.com/1815333.html
It is Trump's positive correlation with turnout, not Biden's, that can be observed in all major competitive states: Pennsylvania, Michigan, Wisconsin, Georgia, Arizona. What is interesting, it is much stronger in precincts than in counties. For example, in Georgia's counties (results [9]), Trump has a rather weak positive correlation with turnout (0.28) while Biden has a rather weak negative correlation (-0.28) – see Figure 8 [13].
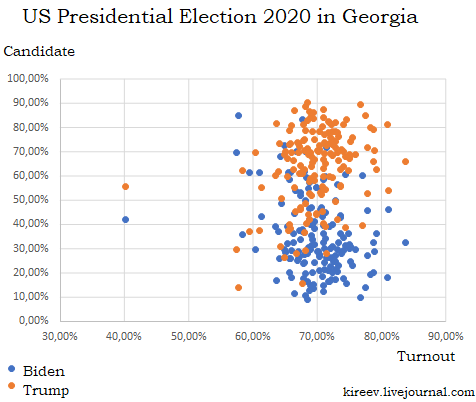
Figure 8. Election results and turnout in the 2020 presidential election broken down by counties in Georgia. Source: https://kireev.livejournal.com/1835610.html
However, if we select results and turnout broken down by precincts (I selected only precincts with over 100 actual voters) in Fulton County [8], where fraud claims were made [7], we will see a much stronger correlation: positive for Trump (0.69) yet again instead of Biden (-0.69). Figure 9 clearly shows the African American part of the county where Biden gained 90% or more and the White part where Biden and Trump have comparable results. These results completely contradict the hypothesis of ballot stuffing in Biden's favor [13].
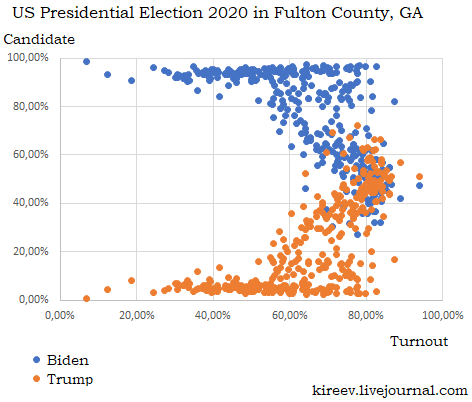
Figure 9. Results and turnout in the 2020 presidential election broken down by precincts in Fulton County, Georgia. Source: https://kireev.livejournal.com/1835610.html
Postal voting does not indicate abnormalities
Record levels of postal voting is one of the more widely discussed moments of the US presidential election, especially so because all the votes were largely casted for Biden. It is true that postal voting in the US was at record high, as was early voting – see Figure 10. Although both indicators had a tendency of growing from election to election, the reason behind such a sharp increase is quite obvious: the COVID-19 pandemic. The pandemic made some states switch to postal voting either entirely, almost entirely or largely.
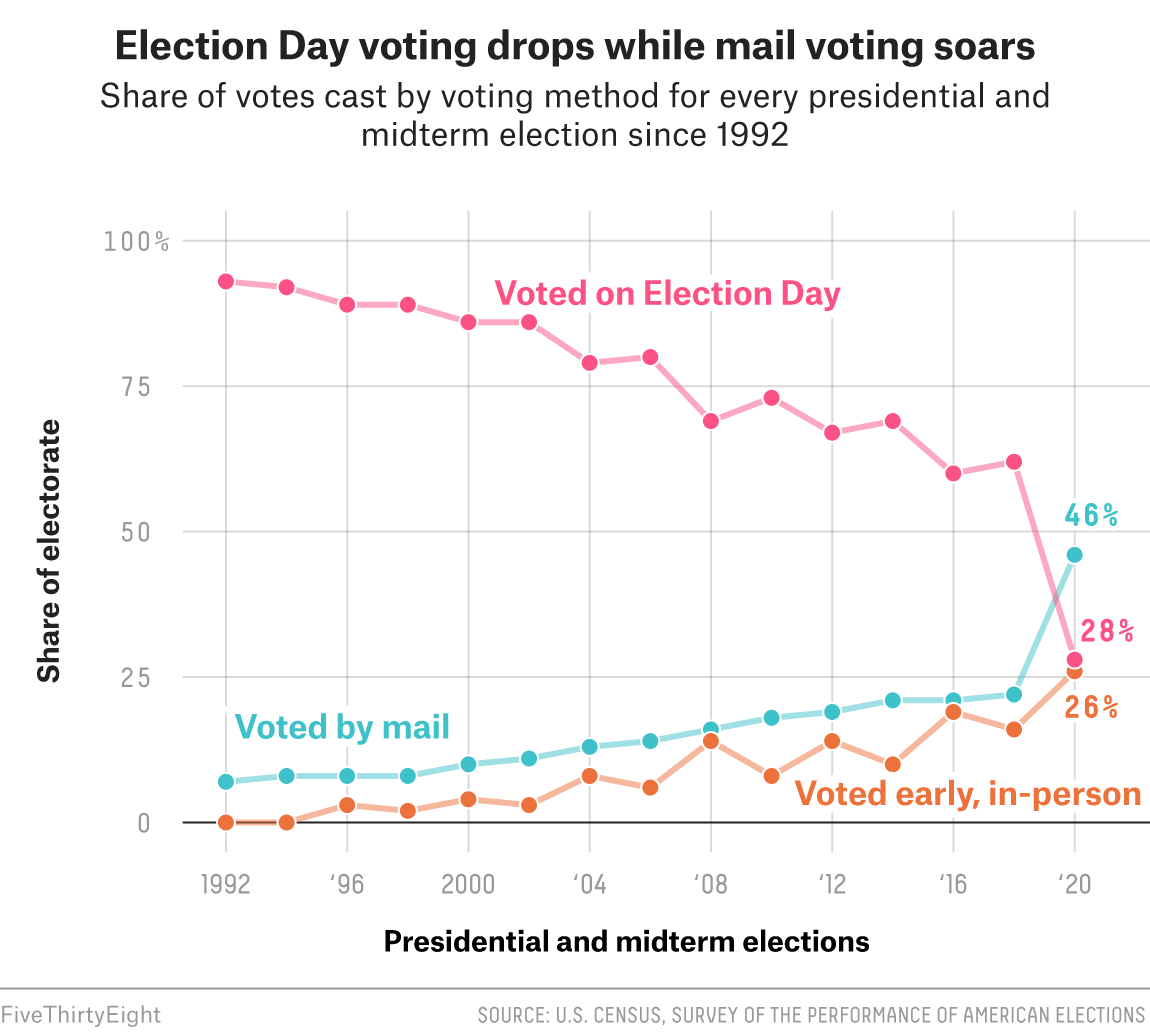
Figure 10. Share of postal voters, early voters at precincts and election day voters at precincts in the 2020 US presidential election. Source: https://fivethirtyeight.com/features/what-absentee-voting-looked-like-in-all-50-states/
In all 15 states that provided the voting data for candidates regardless of the voting method, more votes were casted for Biden by mail rather than at precincts [21]. Explanation for this fact is quite obvious as well: President Trump's active criticism of postal voting started long before the election, and the Democrats took the opposite stance, which manifested through voter preferences.
As such, Biden's advantage in postal voting is not the evidence of fraud in his favor. He had this advantage in all states, both competitive and non-competitive. That is, both in states officially led by Trump and states officially led by Biden himself as well as both Democratic and Republican trifecta states. There is no correlation with these indicators either.
Table 4. Share of votes for candidates depending on the voting method across states (%)
| State | Absentee | Election day | Gap | ||||
| Biden | Trump | margin | Biden | Trump | margin | ||
| Pennsylvania | 76 | 23 | D+54 | 34 | 65 | R+32 | 85 |
| Maryland | 81 | 17 | D+65 | 39 | 57 | R+18 | 83 |
| Hawaii* | 66 | 32 | D+33 | 27 | 71 | R+44 | 77 |
| North Carolina | 70 | 28 | D+42 | 33 | 65 | R+32 | 75 |
| Rhode Island | 79 | 19 | D+60 | 44 | 54 | R+10 | 70 |
| Arkansas | 61 | 37 | D+24 | 26 | 70 | R+43 | 67 |
| Oklahoma | 58 | 40 | D+18 | 26 | 72 | R+46 | 65 |
| Delaware | 79 | 20 | D+59 | 49 | 49 | 0 | 59 |
| Iowa | 57 | 41 | D+16 | 27 | 70 | R+43 | 59 |
| South Carolina | 60 | 39 | D+21 | 31 | 67 | R+35 | 57 |
| Connecticut | 77 | 22 | D+56 | 49 | 49 | 0 | 55 |
| Alaska | 58 | 39 | D+19 | 30 | 66 | R+36 | 54 |
| Georgia | 65 | 34 | D+30 | 38 | 60 | R+23 | 53 |
| Arizona** | 52 | 47 | D+5 | 32 | 66 | R+34 | 38 |
| Texas** | 48 | 51 | R+3 | 39 | 59 | R+20 | 17 |
* There is no separation between voting on election day and early voting in Hawaii.
** There is no separation between voting on election day and early voting in Arizona and Texas.
Source: https://fivethirtyeight.com/features/what-absentee-voting-looked-like-in-all-50-states/
The same trends can also be observed from postal ballot applications and postal voting statistics wherever party registration is present. In all states it is present in, Democrats applied for postal voting more often than Republicans did with no exceptions whatsoever [16]. That said, Pennsylvania [19] and Maryland [15] in particular indicated the largest gap between Democrats and Republicans in applying for postal voting, which predictably manifested in election results.
Let us come back to Fulton County, Georgia. If we assume that stuffing in Biden's favor was done using postal ballots in particular (this is the claim made in Fulton County specifically), we should see abnormalities in the share of postal voting. However, this is nowhere to be seen in Figure 1. It shows the share of Biden's votes and the share of postal votes as a sum of votes casted in all precincts of Fulton County. First, Biden actually has weak negative correlation (-0.19) with the share of postal votes. Democrats mostly vote by mail, but it is easily explained in this case, since African Americans in Georgia has historically voted early in precincts for lack of trust in postal voting. In Fulton County, African Americans represent the majority of Democratic voters. What is more important, this graph does not indicate any sharp increases in postal voting. With the overall county share of 27%, there is only one precinct with a little over 50% of postal votes, which is a precinct with only 122 votes at that. Only five other precincts indicate over 40% of postal ballots, with two being quite small. However, if postal ballots had been scanned several times or stuffed, this would have manifested in sharp increases in postal voting shares in precincts, and we observe nothing of the sort [13].
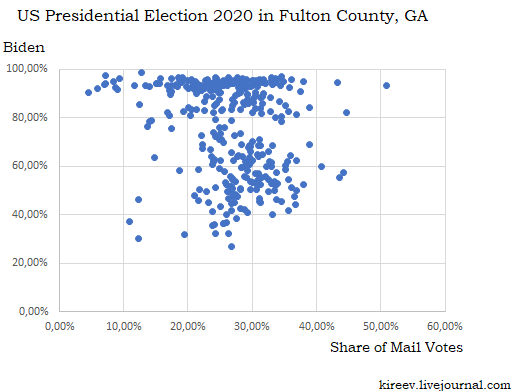
Figure 11. Biden's result and postal voting share in the 2020 presidential election broken down by precincts in Fulton County, Georgia. Source: https://kireev.livejournal.com/1835610.html
Fulton is the county blamed for electoral fraud, located in the state where Biden won by a whisker no less. However, all the results in the county look as the results of a proper and fair election should look. Mind you, this is the state under Republican control, where all the votes were counted thrice, including manual vote count and automated recount requested by Trump campaign.
We would like to stress that this statistical data indicates absence of mass electoral fraud, but cannot disprove multiple violations that can lead to distorted results. For one, this data cannot disprove the fact that somebody might help elderly or frail voters to fill their postal ballots. Neither can it disprove the fact that somebody might fill the ballot for another, if this somebody gets the postal ballot by mistake and even has to forge the signature.
However, the likelihood of such fraud cases as well as actual fraud cases should not be cause for contesting election results themselves if there is no substantial evidence of the scale of said fraud and the fact that it carried a certain candidate to victory. As for the scale, it is unlikely that proponents of fraud will be convinced by the fact that over the years of elections and hundreds of millions of postal ballots in the US, there have been relatively few such cases [6]: and these are the cases that were "intercepted", yet how many were not? In any case, first, certain states perform audits on votes and signatures after the election, and they all confirm that fraud cases are indeed rare. For instance, Georgia's Cobb County performed an audit on signatures that revealed only two potentially suspicious signature, although there were no actual suspicions of forgery [1]. This was the result of two recounts and one audit on all votes casted in the state. Second, people rarely actually commit such fraud for one simple reason: it is not worth it. Forging a vote is a crime punished by law. And the value of forging one vote is insignificant, and the perpetrator is highly unlikely to benefit from the deed in any way.
Finally, the likelihood of fraud itself does not point at Biden being the beneficiary. Many different candidates may be and have been beneficiaries.
Which is why contesting the results of elections themselves requires one to find evidence of mass electoral fraud, which manifest in statistical data. And statistics is exactly the point that prevents Biden's victory from being contested.
Conclusion
Researchers have accumulated extensive statistical evidence of electoral fraud in Russia and other countries. Electoral statistics in the US are very different from the rigged electoral statistics in Russia. The US presidential election results broken down by states, counties and precincts look exactly how proper results are supposed to look. Although such analysis does not disprove small-scale electoral fraud completely, it does disprove the existence of any large-scale fraud that could have swayed the election results even in the most competitive of states.
Received 18.02.2021, revision received 16.03.2021.
References
- Axelrod T. Georgia signature audit finds no fraud in presidential election. – The Hill, 29.12.2020. URL: https://thehill.com/homenews/campaign/532042-georgia-signature-audit-finds-no-fraud-in-presidential-election (accessed 14.03.2021). - https://thehill.com/homenews/campaign/532042-georgia-signature-audit-finds-no-fraud-in-presidential-election
- Cohn N. Mapped: Why Voting Anomalies Are Impossible to Ignore in North Carolina. – The New York Times. 07.12.2018. URL: https://www.nytimes.com/2018/12/07/upshot/mapped-why-voting-anomalies-are-impossible-to-ignore-in-north-carolina.html (accessed 14.03.2021). - https://www.nytimes.com/2018/12/07/upshot/mapped-why-voting-anomalies-are-impossible-to-ignore-in-north-carolina.html
- Coleman J.M. – Twitter, 20.11.2020. URL: https://twitter.com/JMilesColeman/status/1329859731150807041 (accessed 14.03.2021). - https://twitter.com/JMilesColeman/status/1329859731150807041
- Collins K., Fessenden F., Gamio L., Harris R., Keefe J., Lu D., Lutz E., Walker A.S., Watkins D., Yourish K. How Biden Flipped Pennsylvania and Won the Election. – The New York Times, 10.11.2020. URL: https://www.nytimes.com/interactive/2020/11/07/us/elections/pennsylvania-counties-battleground-state.html (accessed 14.03.2021). - https://www.nytimes.com/interactive/2020/11/07/us/elections/pennsylvania-counties-battleground-state.html
- Dominion Voting Official Website. URL: https://www.dominionvoting.com/about/ (accessed 14.03.2021). - https://www.dominionvoting.com/about/
- Election Fraud Cases. – The Heritage Foundation. URL: https://www.heritage.org/voterfraud/search (accessed 14.03.2021). - https://www.heritage.org/voterfraud/search
- Fichera A. Video Doesn’t Show ‘Suitcases’ of Illegal Ballots in Georgia. – Factcheck.org, 04.12.2020. URL: https://www.factcheck.org/2020/12/video-doesnt-show-suitcases-of-illegal-ballots-in-georgia/ (accessed 14.03.2021). - https://www.factcheck.org/2020/12/video-doesnt-show-suitcases-of-illegal-ballots-in-georgia/
- Fulton County, Georgia, General Election 2020 Results. – Georgia Secretary of State. URL: https://results.enr.clarityelections.com//GA/Fulton/105430/271723/reports/detailxls.zip (accessed 14.03.2021). - https://results.enr.clarityelections.com//GA/Fulton/105430/271723/reports/detailxls.zip
- Georgia General Election 2020 Results. – Georgia Secretary of State. URL: https://results.enr.clarityelections.com//GA//105369/271927/reports/detailxls.zip (accessed 14.03.2021). - https://results.enr.clarityelections.com//GA//105369/271927/reports/detailxls.zip
- Georgia Interactive Precinct Viewer. – ESRI. URL: https://gisanddata.maps.arcgis.com/apps/MapSeries/index.html?appid=5d930a3281ad403391b1d9b3f7f9d145 (accessed 14.03.2021). - https://gisanddata.maps.arcgis.com/apps/MapSeries/index.html?appid=5d930a3281ad403391b1d9b3f7f9d145
- Henry County, Georgia. – Wikipedia. URL: https://en.wikipedia.org/wiki/Henry_County,_Georgia (accessed 14.03.2021). - https://en.wikipedia.org/wiki/Henry_County,_Georgia
- Kireyev A. Pokazhite mne v etikh dannykh falsifikatsiyu, kak eto bylo v Sev. Karoline v 2018 g. [Show Me the Electoral Fraud in This Data, Like It Was in North Carolina in 2018]. – LiveJournal, 24.11.2020. URL: https://kireev.livejournal.com/1815333.html (accessed 14.03.2021). (In Russ.) - https://kireev.livejournal.com/1815333.html
- Kireyev A. V okruge Fulton net sovershenno nikakikh priznakov falsifikatsii rezultatov vyborov [There are Absolutely No Signs of Electoral Fraud in Fulton County]. – LiveJournal, 21.01.2021. URL: https://kireev.livejournal.com/1835610.html (accessed 14.03.2021). (In Russ.) - https://kireev.livejournal.com/1835610.html
- Kobak D., Shpilkin S., Pshenichnikov M.S. Statistical fingerprints of electoral fraud? – Significans. 2016. V. 13. No. 4. P. 20–23. URL: https://rss.onlinelibrary.wiley.com/doi/full/10.1111/j.1740-9713.2016.00936.x (accessed 14.03.2021). DOI: 10.1111/j.1740-9713.2016.00936.x. - https://rss.onlinelibrary.wiley.com/doi/full/10.1111/j.1740-9713.2016.00936.x
- Maryland Early Voting Statistics. – U.S. Election Project. 01.11.2020. URL: https://electproject.github.io/Early-Vote-2020G/MD.html (accessed 14.03.2021). - https://electproject.github.io/Early-Vote-2020G/MD.html
- McDonald M. 2020 General Election Early Vote Statistics. – U.S. Election Project. 23.11.2020. URL: https://electproject.github.io/Early-Vote-2020G/index.html (accessed 14.03.2021). - https://electproject.github.io/Early-Vote-2020G/index.html
- National Exit Poll 2016. – CNN. 2016. URL: https://www.cnn.com/election/2016/results/exit-polls (accessed 14.03.2021). - https://www.cnn.com/election/2016/results/exit-polls
- National Exit Poll 2020. – CNN. 2020. URL: https://www.cnn.com/election/2020/exit-polls/president/national-results (accessed 14.03.2021). - https://www.cnn.com/election/2020/exit-polls/president/national-results
- Pennsylvania Early Voting Statistics. – U.S. Election Project. 20.11.2020. URL: https://electproject.github.io/Early-Vote-2020G/PA.html (accessed 14.03.2021). - https://electproject.github.io/Early-Vote-2020G/PA.html
- Pshenichnikov M. Moskva otzhigayet [Moscow is On Fire]. – LiveJournal, 05.03.2012. URL: https://oude-rus.livejournal.com/581302.html (accessed 14.03.2021). (In Russ.) - https://oude-rus.livejournal.com/581302.html
- Rakich N., Mithani J. What Absentee Voting Looked Like In All 50 States. – FiveThirtyEight Website, 09.02.2021. URL: https://fivethirtyeight.com/features/what-absentee-voting-looked-like-in-all-50-states/ (accessed 14.03.2021). - https://fivethirtyeight.com/features/what-absentee-voting-looked-like-in-all-50-states/
- Silver N. – Twitter, 30.11.2018. URL: https://twitter.com/NateSilver538/status/1068335913162481664 (accessed 14.03.2021). - https://twitter.com/NateSilver538/status/1068335913162481664
- Starr County, Texas. – Wikipedia. URL: https://en.wikipedia.org/wiki/Starr_County,_Texas (accessed 14.03.2021). - https://en.wikipedia.org/wiki/Starr_County,_Texas
- United States Presidential Election Results. – Dave Leip’s Atlas of U.S. Elections. URL: https://uselectionatlas.org/RESULTS/ (accessed 14.03.2021). - https://uselectionatlas.org/RESULTS/
- Wasserman D., Andrews S., Saenger l., Cohen L., Flinn A., Tatarsky G. 2020 National Popular Vote Tracker. – Cook Political Report. 2020. URL: https://cookpolitical.com/2020-national-popular-vote-tracker (accessed 14.03.2021). - https://cookpolitical.com/2020-national-popular-vote-tracker