 Andrei Yu. Buzin
Candidate of Physico-mathematical Sciences and Candidate of Legal Sciences, [email protected]
Overview of Electoral Statistics for the 2025 Regional Head Elections
Abstract
This study analyzes voting statistics from the September 2025 elections of twenty governors in Russia. The findings show that the introduction of three-day voting REV significantly altered voting patterns, notably increasing the share of ballots cast outside polling stations. In two regions, these methods also led to a marked rise in early voting. The distributions of electoral commissions by turnout and by off-site voting likewise shifted. The proportion of voters participating on the first day was considerably higher than on Saturday or Sunday. A correlation was found between the incumbent’s performance and the share of votes cast on the first day. REV, implemented in ten of the twenty regions, did not provide a measurable advantage to incumbents. Graphs based on the modified Sobyanin-Sukhovolsky method are presented for all twenty elections analyzed.
The latest Unified Voting Day (UVD) took place on September 14, 2025. In most regions, voting was conducted over a three-day period, from September 12 to 14. In some cases, this was preceded by the so-called "early voting" (with the city of Sevastopol standing out in this regard), while a number of regions also made use of remote electronic voting (REV).
The introduction of three-day voting and REV significantly altered the nature of electoral statistics. These changes had a profound impact on the distributions of electoral commissions by voter turnout, off-site voting (at-home voting, to put it tentatively), and early voting. These distributions took on an even more unusual appearance when compared with the corresponding distributions prior to the introduction of three-day voting and REV.
The changes can be illustrated using the example of twenty regional head elections held from September 12 to 14, 2025. We rely on official statistical evidence, which was obtained with considerable difficulty from the SAS "Vybory" system. It should be noted that, contrary to the legally established principle of transparency and openness in the activities of electoral commissions, the organizers of Russian elections actively obstruct access to these data, encrypting them and making them difficult to obtain. Nevertheless, the skill of the election organizers in concealing the data has so far been outmatched by the public’s initiative in acquiring them.
Three-day voting
In 19 out of the 20 regions where head elections were held, a three-day voting period was used (that is, voting took place on Friday, Saturday, and Sunday). In some regions, early voting was also conducted, but it played a significant role only in Sevastopol and in Kursk Oblast. The Republic of Tatarstan was the only region to hold the election exclusively on Sunday. Data on the progress of voting (see fig. 1) indicate that the majority of voters (41% across regions on average) cast their ballots either during early voting or on the first day of voting. Roughly the same shares of voters participated on Saturday and Sunday – 27% and 24%, respectively. Therefore, according to official statistics, out of the three voting days, voters most frequently chose Friday and least frequently Sunday.
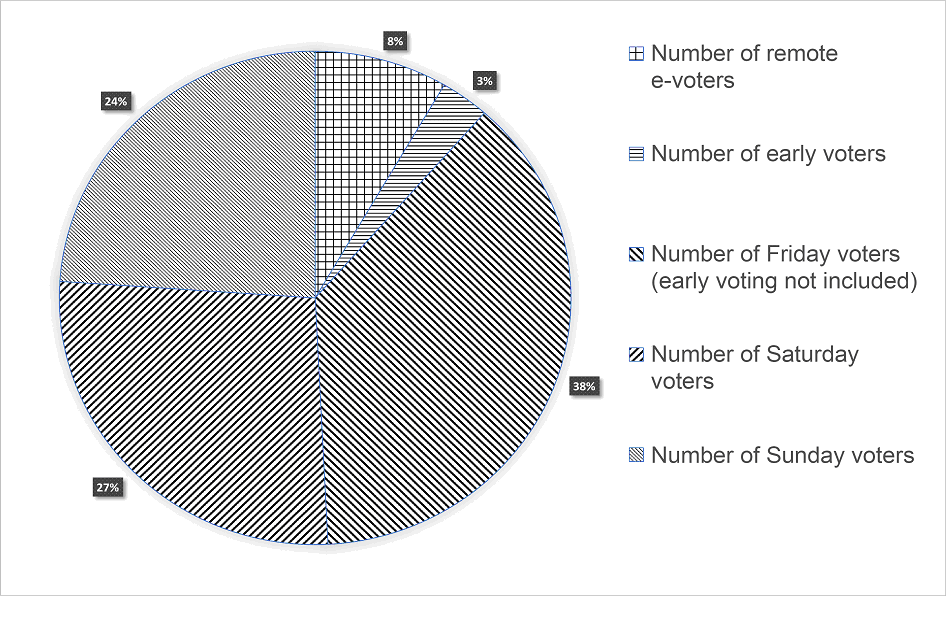
Figure 1. Breakdown of voting by day and type
Figure 1 does not accurately reflect the role of early voting, as it merges the substantial early voting observed in the city of Sevastopol and Kursk Oblast with the comparatively low early voting levels in other regions. Figure 2 shows the distribution of different voting types across regions.
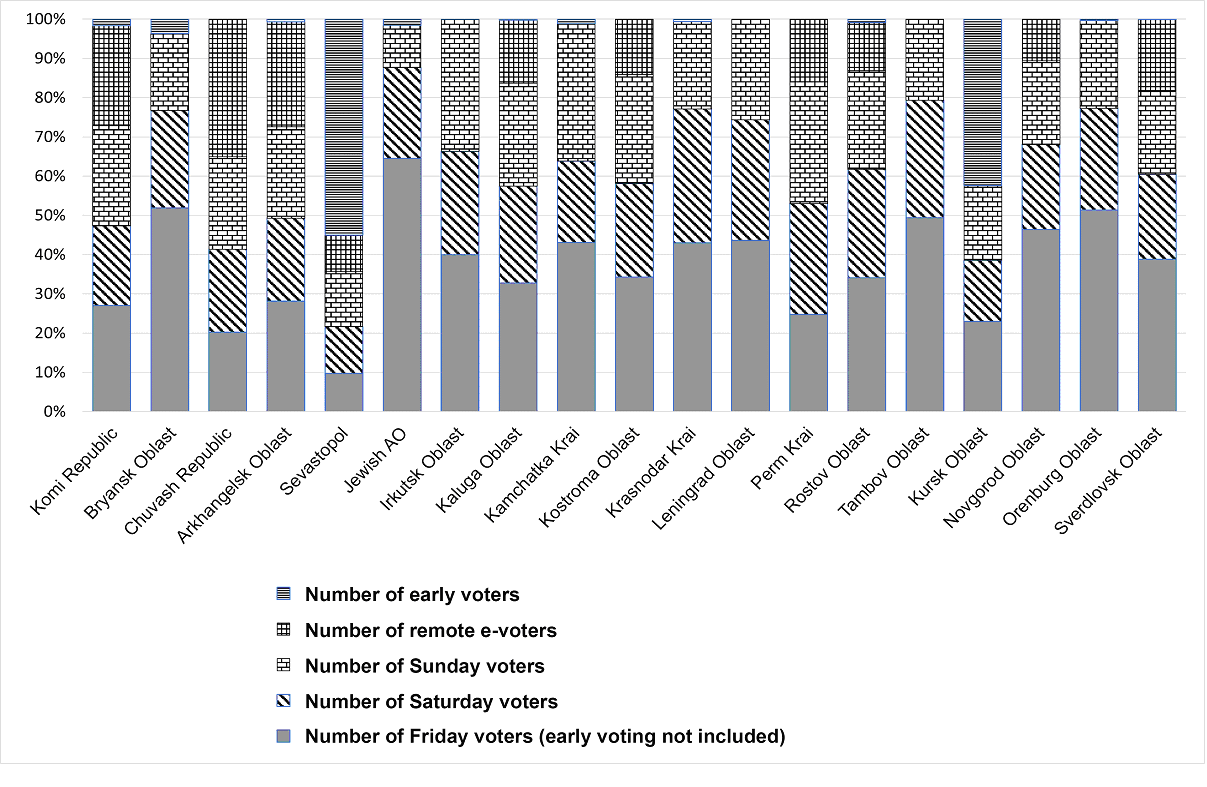
Figure 2. Breakdown of voting by day and type
In Sevastopol and Kursk Oblast, early voting accounted for 55.0% and 42.4% of all voters who took part in the election, respectively. As a result, the share of votes cast on Friday in these federal subjects was comparatively low. The highest proportion of Friday voting was recorded in the Jewish Autonomous Oblast (66.1%), while the lowest (if we exclude Sevastopol and Kursk Oblast) was observed in Perm Krai (24.8%). Notably, in the Jewish AO, as well as in Bryansk and Orenburg oblasts, more than half of all participating voters cast their ballots on Friday.
The largest share of Sunday voting was observed in Kamchatka Krai (35.0%), and the smallest in the Jewish AO (10.8%).
Official statistics show that, on average, a greater proportion of votes for the incumbent were cast on Friday than on Sunday. Across 19 regions (excluding Tatarstan), there is a strong (+54.5%) and statistically significant (at the 5% level) positive correlation between the share of Friday voting and the incumbent’s final result. Conversely, the correlation between Sunday voting and the incumbent’s result is negative (-54.7%) and statistically significant for the same elections and significance level.
REV
This method of voting, which is not subject to public oversight, demonstrates turnout levels approaching full participation, largely due to its registration-based design. The right to vote remotely is granted to voters who register in advance for this type of voting. Nevertheless, the federal REV system allows that a registered voter may ultimately choose not to cast a ballot. As a result, the share of registered voters who actually participated in REV ranged from 87.2% in Sevastopol to 93.7% in Chuvashia in these elections. REV was used in 10 of the 20 regions holding head elections. The proportion of voters using REV, as a share of all participating voters, varied across regions – from 9% in Sevastopol to 35% in Chuvashia. The overall picture of REV participation is shown in Figure 3.
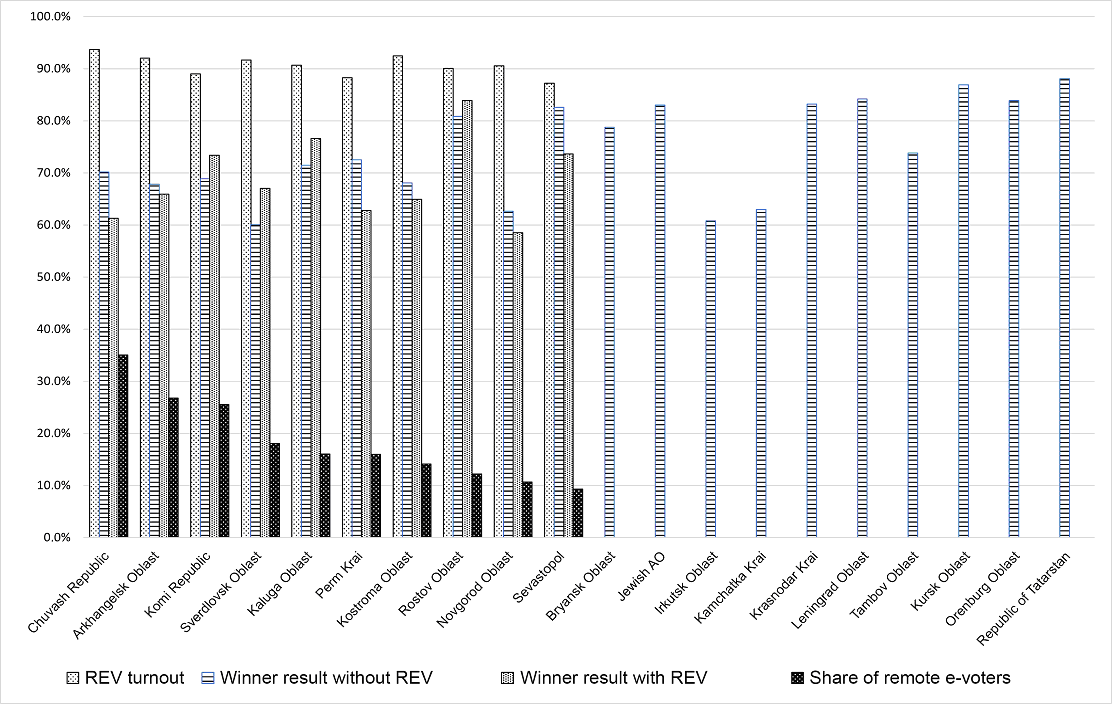
Figure 3. Results of regional head elections with and without REV in 2025
It can be seen from this figure that in the 2025 regional head elections, REV provided an advantage to the incumbent in only four out of ten cases. There were no instances comparable to Moscow, where the advantage gained through REV would outweigh the shortage in votes obtained via paper ballots. However, the share of votes cast through this method did not exceed one-third of all votes in any region except Chuvash Republic (this share was 95.3% during the 2024 UVD in Moscow).
It is apparent that in regions using REV, the results for the winner in REV closely matched the results obtained via paper ballots. In regions without REV, incumbents generally achieved higher results than in regions with REV: the average winning share across regions without REV was 78.6%, compared to only 70.5% in regions with REV. Thus, there is no basis in these elections to suspect REV of manipulating results. The situation is similar to the use of electronic ballot-counting machines (KOIB), which had long been considered reliable, but were later manipulated in the 2018 gubernatorial election in Primorsky Krai [1]. In any case, it can be argued that unverified REV increases the potential for its use in election result manipulation.
At the same time, one may say there is an evident trend toward the expansion of REV: on the 2024 UVD, it was used in regional elections in eight regions, whereas in 2025 it was implemented in fourteen. That said, the average share of REV votes (excluding Moscow) increased from 16.8% in 2024 to 18.2% in 2025.
In the study of large-scale elections, it is common to use a graph showing the distribution of an electoral roll by turnout [2]. The more homogeneous the voter community, the closer this distribution is to a unimodal pattern resembling a Gaussian distribution. Heterogeneity, however, can distort the distribution away from unimodality and create asymmetry. When voter turnout is largely uniform across most precincts, the distribution graph becomes very narrow, with an exceptionally high peak at the mode of turnout. Such patterns were observed in official statistics of Soviet-era elections and, more recently, in certain republics in the Caucasus region. A similar effect occurs with REV, when remotely voting citizens are effectively grouped into a single hypothetical precinct.
This phenomenon can be illustrated using examples from certain elections in Moscow (fig. 4) and in Chuvashia (fig. 5).
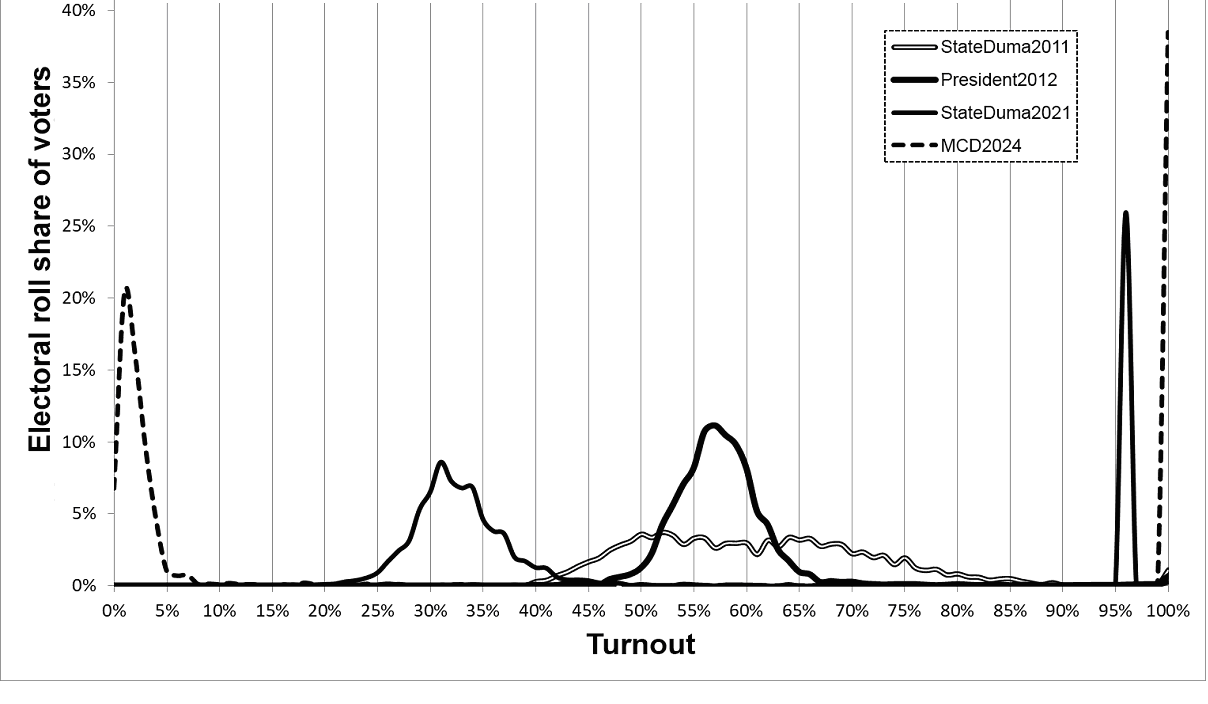
Figure 4. Distribution of electoral rolls by turnout in selected elections in Moscow
The 2012 graph represents a natural distribution observed during the 2012 presidential election in Moscow. In contrast, the 2011 graph indicates widespread falsifications during the 2011 Moscow election to the State Duma. The 2021 graph, when REV was used in Moscow, split into two distinct sections, with the left side reflecting the distribution under regular voting and the right side showing an REV-corresponding peak. This effect was even more pronounced in the 2024 Moscow City Duma election. It is worth noting that the left portions of the split distributions in 2021 and 2024 appear entirely natural and do not raise suspicion.
Figure 5 shows the emergence of a pronounced peak associated with the use of REV in the 2025 elections.
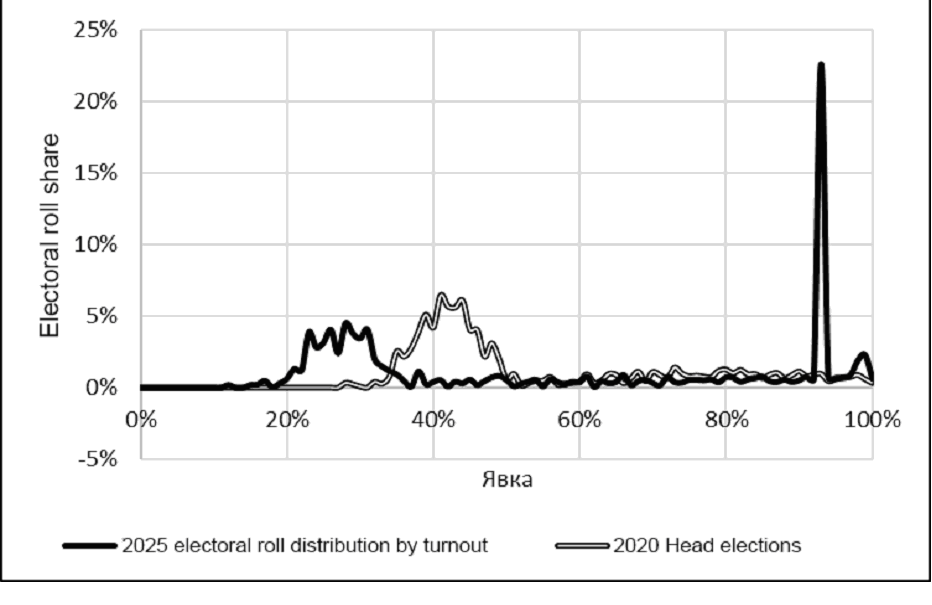
Figure 5. Distribution of electoral rolls by turnout in regional head election in the Chuvash Republic
Off-site voting and early voting
The introduction of multi-day voting and REV dramatically altered the structure of voting. In addition to the emergence of a substantial share of remote e-voters, the proportion of voters participating through off-site voting also increased significantly. In Kursk Oblast and the city of Sevastopol, early voting similarly saw a substantial increase. These types of voting offer fewer opportunities to public oversight than regular voting on the main election day.
Table 1 presents statistics for these types of voting in the 2025 regional head elections. For comparison, the table also shows the share of these voting methods (as a percentage of total participants) in the 2018 Russian presidential election, prior to the introduction of multi-day voting.
As shown in table 1, off-site voting increased substantially in all regions except Tatarstan. This increase is associated with a high volume of off-site voting during the first days of the voting period.
Table 1. Early voting and off-site voting in the 2025 Regional Head Elections compared with the 2018 Russian Presidential Election
| Region hosting the head election in 2025 | REV share (as a percentage of total voters) %% | Early voting share %% | Off-site voting share %% | Early voting share %% (at the 2018 presidential election) |
Off-site voting share %% (at the 2018 presidential election) |
| Chuvash Republic | 35.0 | 0.0 | 21.4 | 0 | 6.7 |
| Arkhangelsk Oblast | 26.7 | 0.7 | 20.9 | 0.7 | 4.3 |
| Komi Republic | 25.5 | 1.6 | 9.4 | 1.6 | 4.1 |
| Sverdlovsk Oblast | 18.1 | 0.1 | 11.2 | 0.2 | 3.8 |
| Perm Krai | 15.9 | 0 | 19.6 | 0.4 | 7.7 |
| Kaluga Oblast | 14.8 | 0.2 | 19.7 | 0 | 7.9 |
| Kostroma Oblast | 14.1 | 0 | 18.0 | 0 | 7.2 |
| Rostov Oblast | 12.2 | 0.8 | 12.1 | 0 | 7.7 |
| Novgorod Oblast | 10.6 | 0 | 10.8 | 0 | 7.6 |
| Sevastopol | 9.3 | 55.0 | 9.7 | 0.3 | 3.2 |
| Republic of Tatarstan | 0 | 0 | 3.9 | 0 | 4.6 |
| Orenburg Oblast | 0 | 0.4 | 17.8 | 0 | 6.8 |
| Kursk Oblast | 0 | 42.4 | 18.3 | 0 | 11.6 |
| Tambov Oblast | 0 | 0 | 27.7 | 0 | 12.0 |
| Leningrad Oblast | 0 | 0 | 21.5 | 0 | 7.2 |
| Krasnodar Krai | 0 | 0.6 | 15.1 | 0 | 10.4 |
| Kamchatka Krai | 0 | 1.1 | 9.2 | 1.2 | 3.6 |
| Irkutsk Oblast | 0 | 0 | 7.9 | 0 | 4.8 |
| Jewish AO | 0 | 1.5 | 15.9 | 0.1 | 5.3 |
The table is not fully displayed Show table
It is unlikely that the increase in these types of voting can be explained simply by a reduced willingness of voters to cast their ballots at polling stations. This is indirectly confirmed by the dramatic change in the distribution of electoral rolls (roughly corresponding to the number of election commissions) by the share of off-site voters (fig. 6).
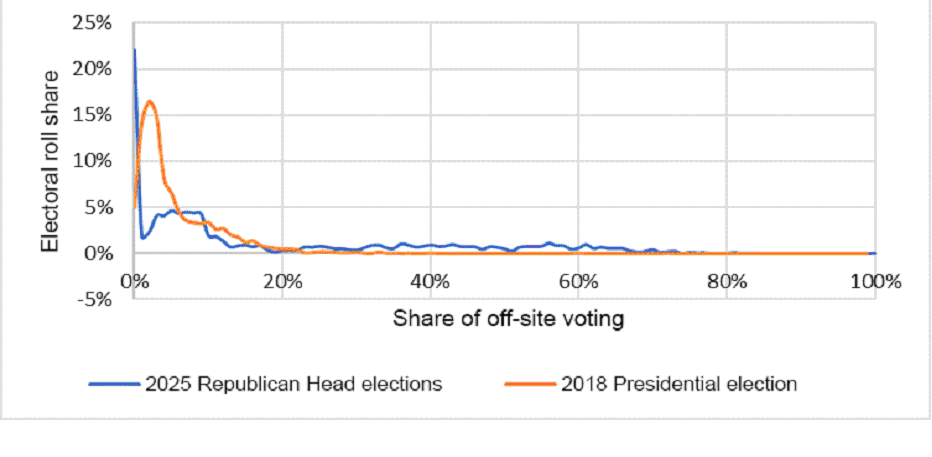
Figure 6. Electoral roll distribution by off-site voting share in the Chuvash Republic
In Kursk Oblast and the city of Sevastopol, the regional head elections involved widespread early voting, carried out by the majority of precinct electoral commissions. This, however, can be explained by the exceptional military circumstances in these regions in 2025.
Competition
Competition was effectively absent in the 2025 regional head elections. The difference between the vote shares of the winner and the runner-up ranged from a minimum of 46.1% in Sverdlovsk Oblast to a maximum of 83.1% in Tatarstan. However, this situation has persisted for some time, essentially since 2012, when regional head elections were reinstated, but with the added municipal filter [4: 810–846].
Dependence of results on turnout
The increase in the incumbent’s vote share with higher turnout can be explained both by direct falsifications (ballot stuffing, vote inflation) and by coercion of voters to support the incumbent. These mechanisms form the basis of the Sobyanin-Sukhovolsky [5: 101–107; 7] and Shpilkin [5: 109–112; 6] methods, which are widely used to analyze vote returns. Of course, an alternative explanation is possible: voters loyal to the authorities may be more likely to participate in elections than non-loyal voters. Therefore, the Shpilkin method is especially informative when applied in a historical retrospective, while the Sobyanin-Sukhovolsky method should be modified to cover the full range of turnout levels, not just the area around final turnout [3].
Across the studied elections, the incumbent’s results increased steadily wherever turnout was high. However, in areas of low and medium turnout, it could remain constant or even decrease. The graphs below illustrate how two electoral indicators changed for the incumbent and the runner-up (by number of votes received) as a function of turnout in the 2025 regional head elections. The first indicator, denoted by v, is the share of votes for the candidate out of all participating voters (that is, at the right end of the graph, this value corresponds to the candidate’s overall vote share in the region). The second indicator, denoted by a, will be referred to as the "Sobyanin-Sukhovolsky coefficient" [7]. Sobyanin and Sukhovolsky compared the right ends of the graphs and argued that if the right end of the second graph is substantially higher than that of the first, there is reason to suspect turnout-related fraud.
A common feature across all graphs is that the curves for the incumbent lie substantially above those of the runner-up in almost every case. This indicates that there was no real competition in these elections. Clearly, this diminishes the utility of detecting direct fraud: in elections of this type, direct fraud has little impact.
Another consistent observation is that the v curves for the incumbent increase across most turnout levels. At sufficiently high turnout, the a curve sometimes lies significantly above the v curve; in such cases, the Sobyanin-Sukhovolsky criterion allows for the suspicion of fraud.
The jumps observed in the v graphs in figures 7–26 give cause for suspicion. The reasons behind them are discussed in the commentary accompanying the graphs.
In figure 7, the winner’s vote share rises steadily as turnout increases. However, in the turnout range of 20–27%, which includes many PECs (the number of such PECs – or, more precisely, the number of voters on their electoral rolls – can be estimated by the density of points on the graph), the voting pattern appears roughly uniform, although even within this range the incumbent still leads the runner-up by a significant margin. The sharp increase in turnout (near 92%) is linked to REV.
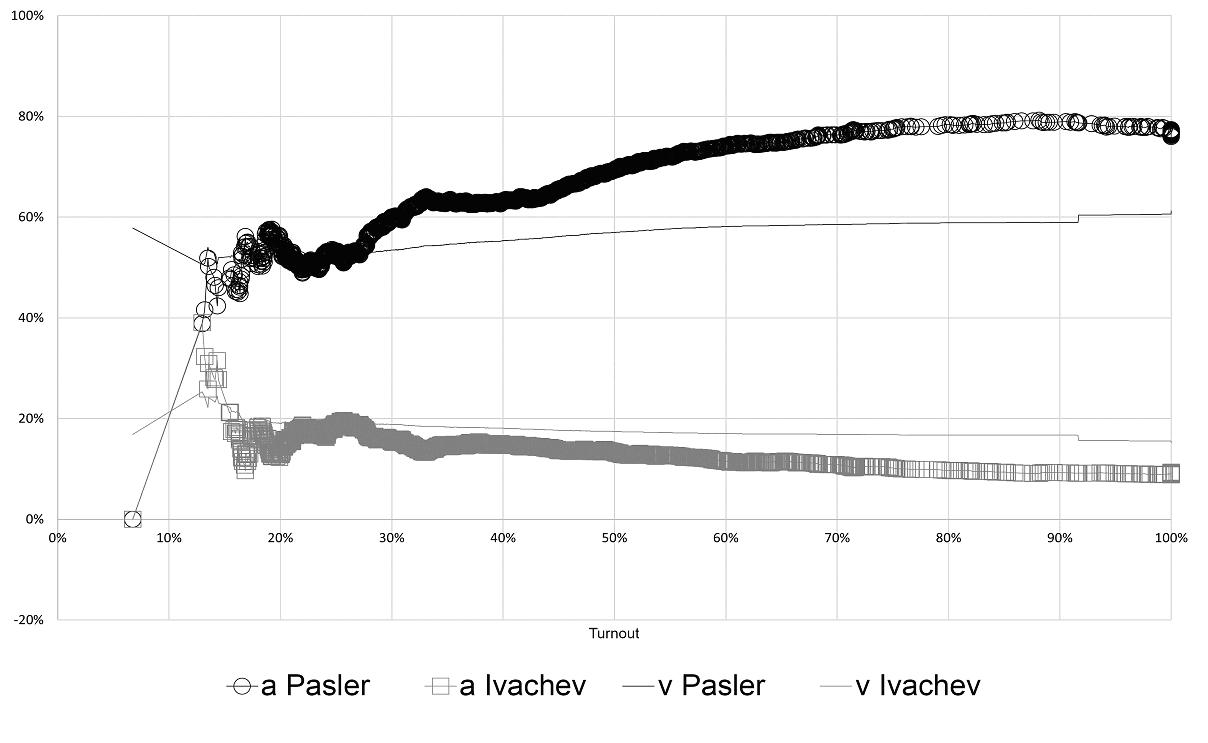
Figure 7. Relationship of v and a indicators and turnout in the early gubernatorial election in Sverdlovsk Oblast
The patterns shown in figure 8 indicate that both voting and vote counting in this election were generally conducted in an honest manner.
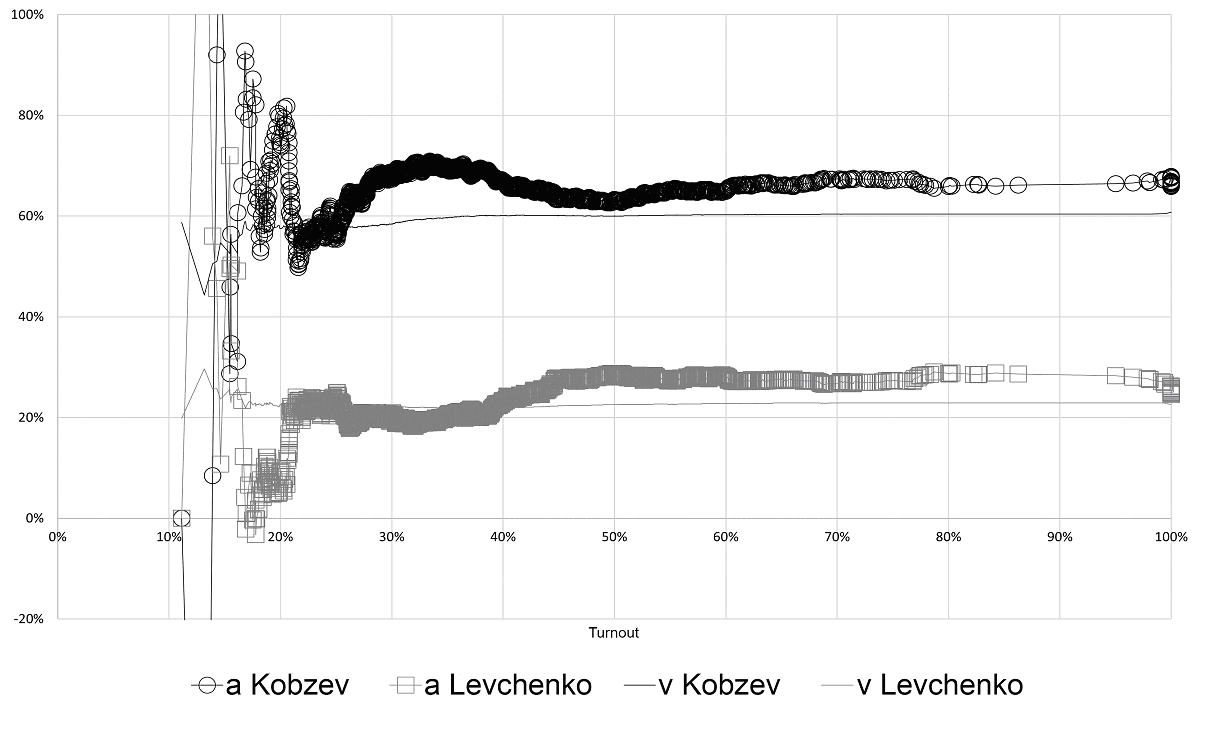
Figure 8. Relationship of v and a indicators and turnout in the gubernatorial election in Irkutsk Oblast
The drop in the incumbent’s curve at turnout levels of 25–35% (see fig. 9) suggests that some PECs conducted voting relatively fairly, whereas others (with higher turnout figures) may have engaged in fraud.
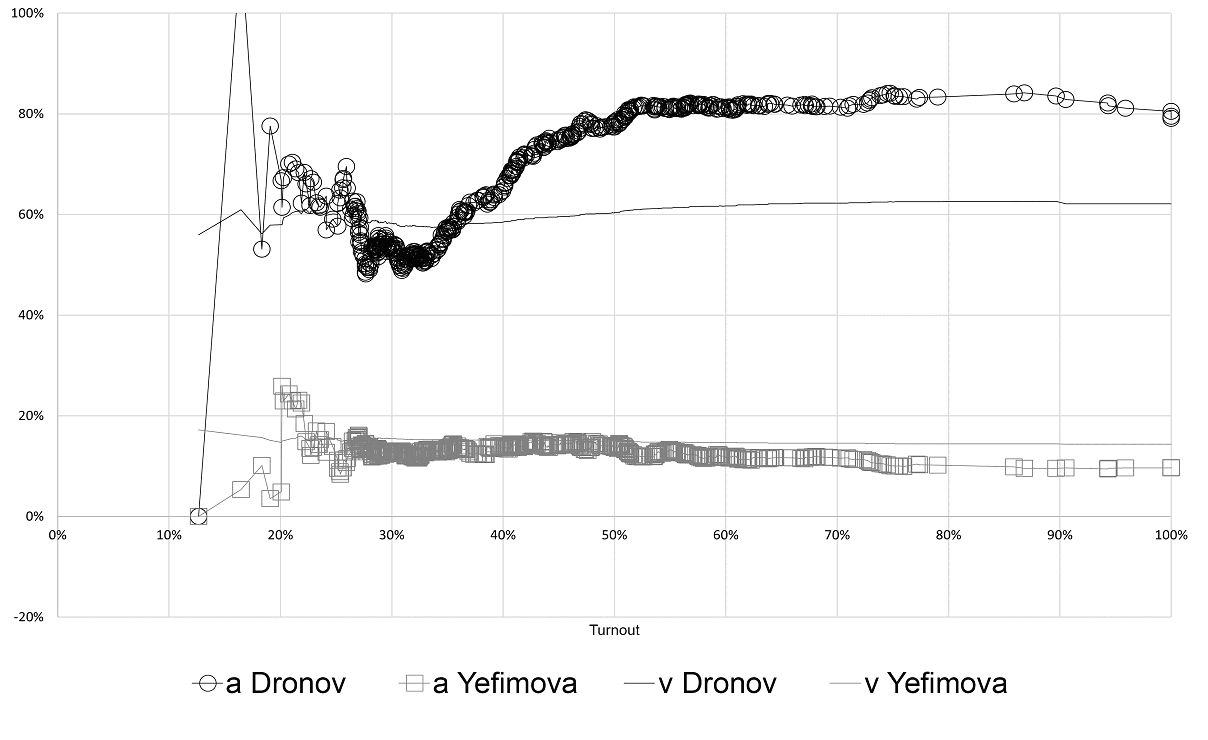
Figure 9. Relationship of v and a indicators and turnout in the early gubernatorial election in Novgorod Oblast
Since the Kamchatka Krai gubernatorial election involved relatively few precinct electoral commissions, the graph in figure 10 primarily shows that commissions with a small number of voters and full (100%) turnout had a significant impact on the results.
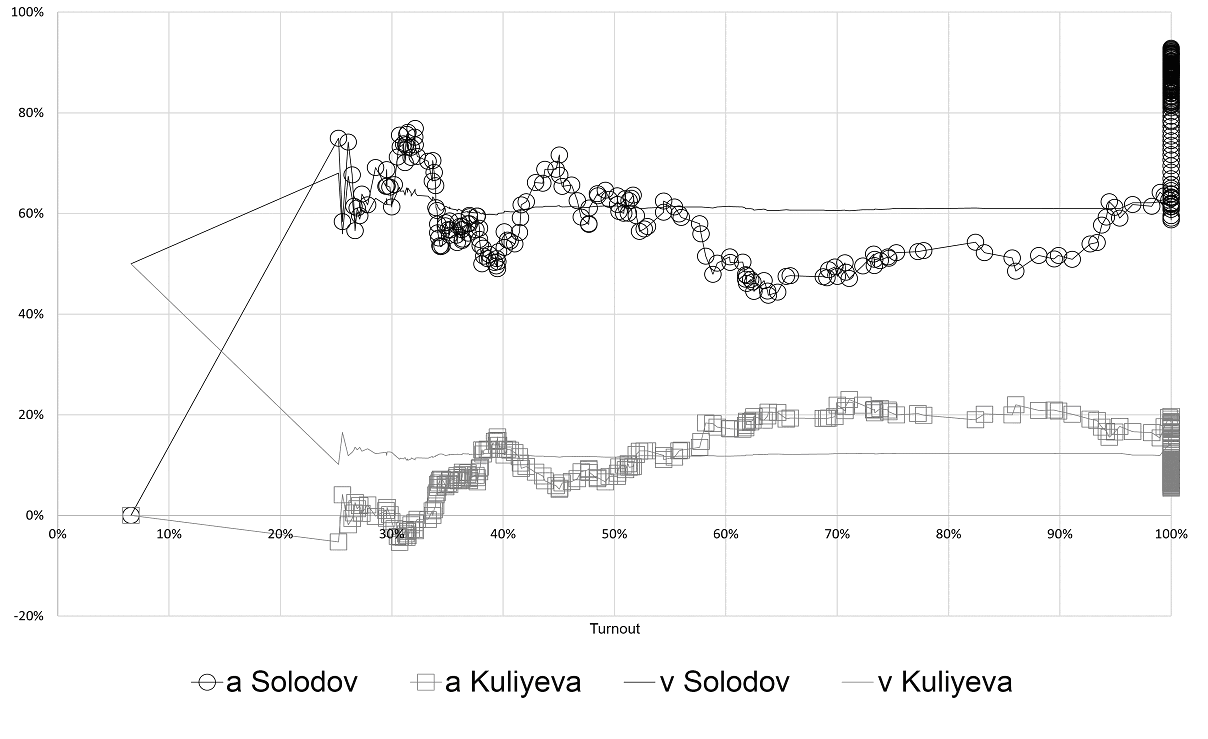
Figure 10. Relationship of v and a indicators and turnout in the gubernatorial election in Kamchatka Krai
As shown in Figure 11, both voting and vote counting appear to have been relatively fair. About 2% of the incumbent’s total came from precinct commissions reporting full (100%) turnout. There was a total of 29 such commissions.
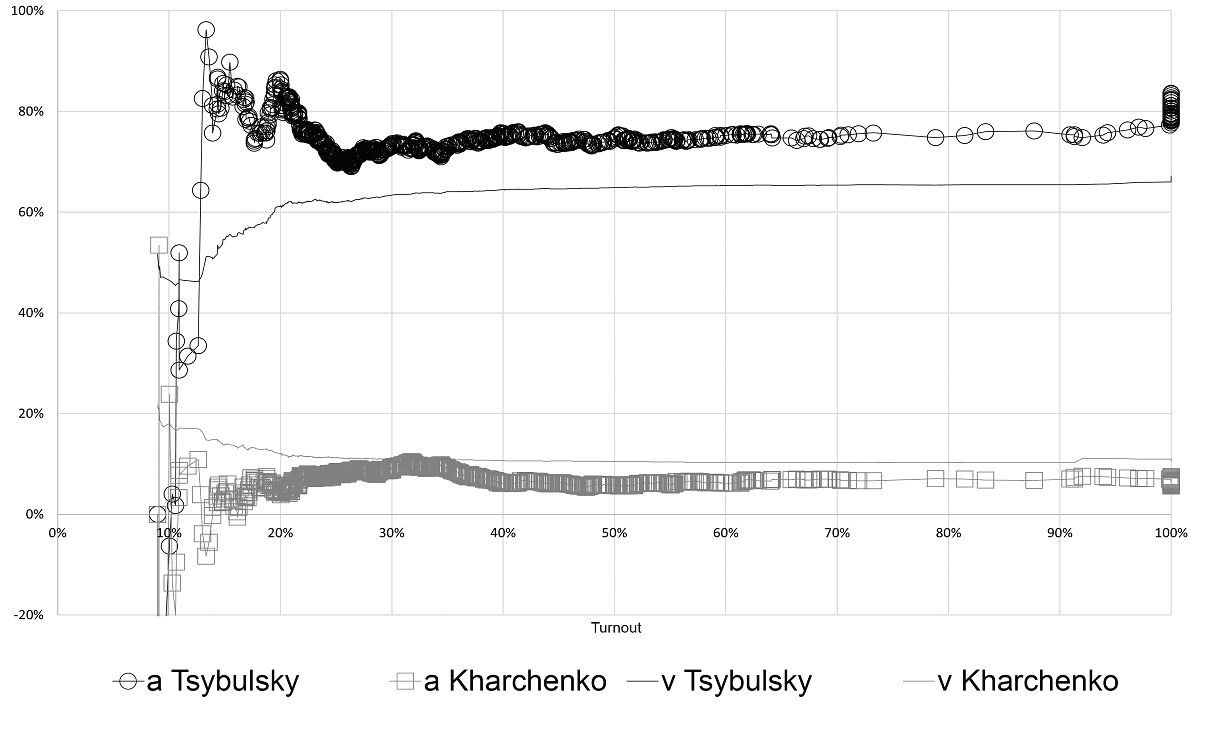
Figure 11. Relationship of v and a indicators and turnout in the gubernatorial election in Arkhangelsk Oblast
As seen in Figure 12, the incumbent’s result rises steadily with increasing turnout. At the same time, the Sobyanin-Sukhovolsky coefficient remains consistently above the winner’s vote share. These patterns suggest possible falsifications, appearing to be evenly distributed across turnout levels beginning at around 30%.
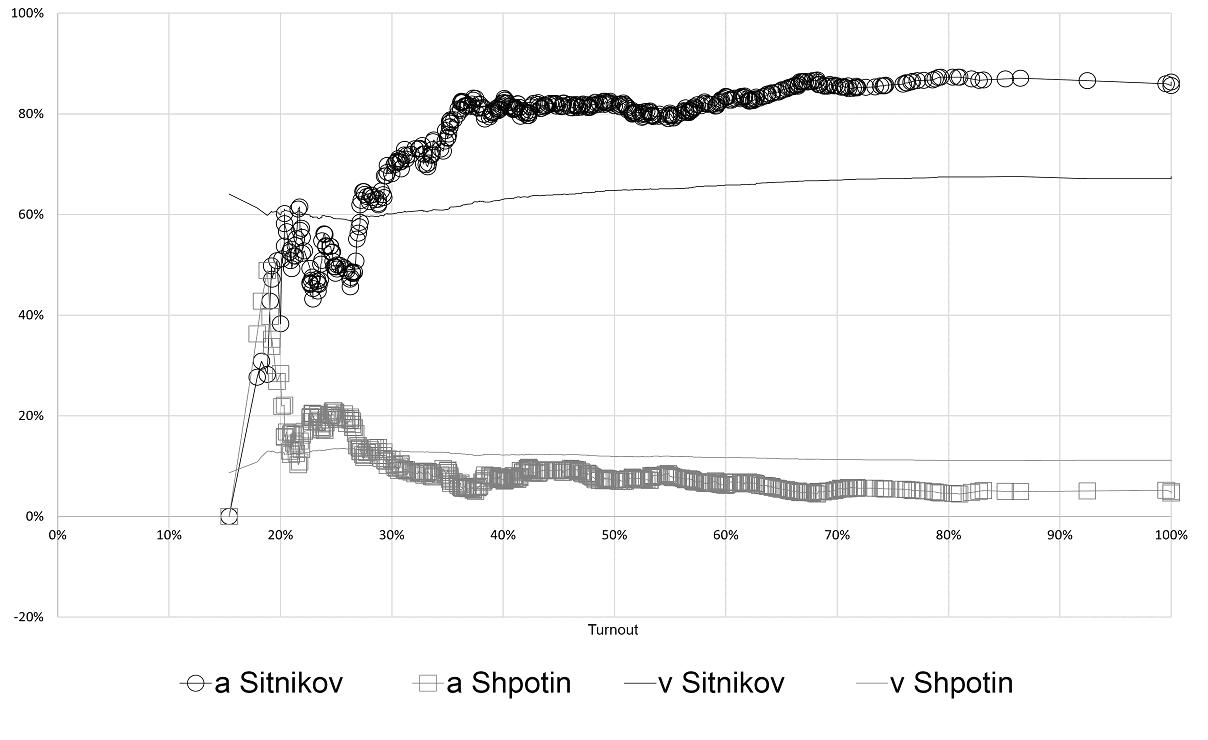
Figure 12. Relationship between v and a indicators and turnout in the gubernatorial election in Kostroma Oblast
In the Komi Republic, REV yielded a 4.5% advantage for the winner compared to paper ballot voting. This effect is visible in figure 13 at the turnout level of about 89%.
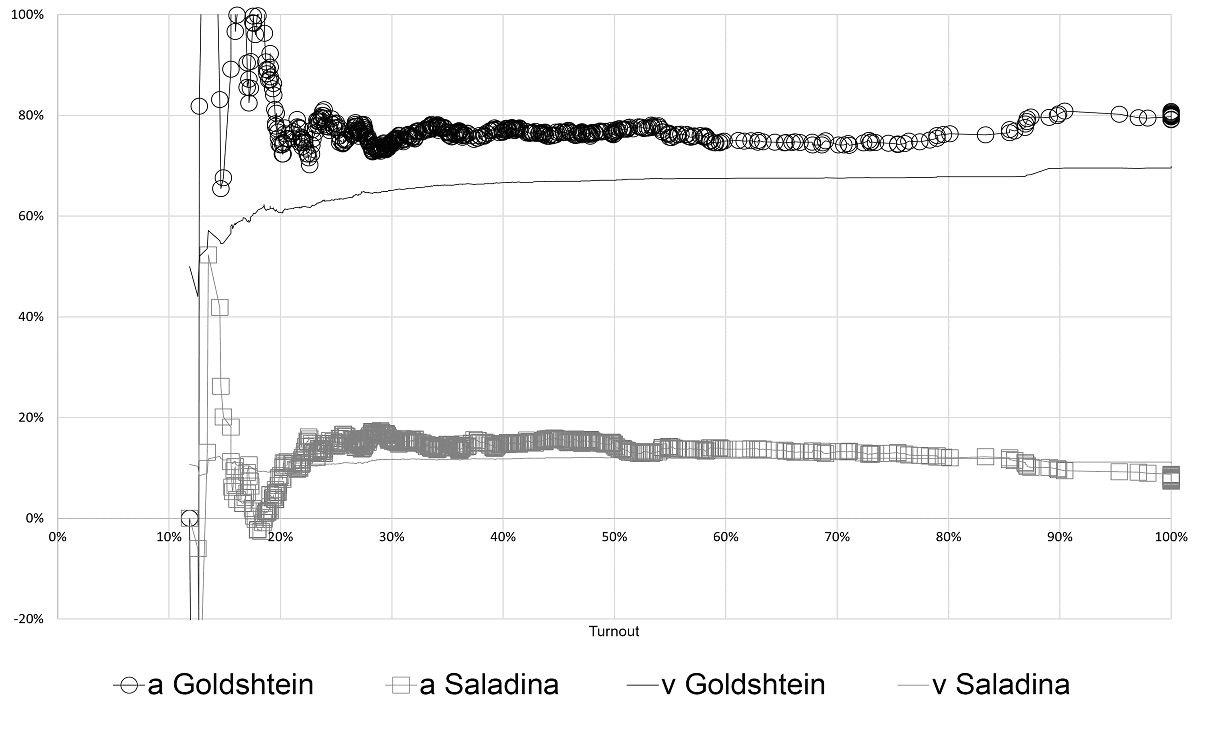
Figure 13. Relationship between v and a indicators and turnout in the Komi Republic Head election
Beginning at around 24% turnout, figure 14 shows a steady, hard-to-explain increase in the incumbent’s vote share. A turnout of 27% was recorded across many PECs, covering about 7% of all registered voters. A distinct spike near 94% turnout corresponds to REV. Taken together, these patterns suggest that in-person voting at polling stations was likely not entirely natural.
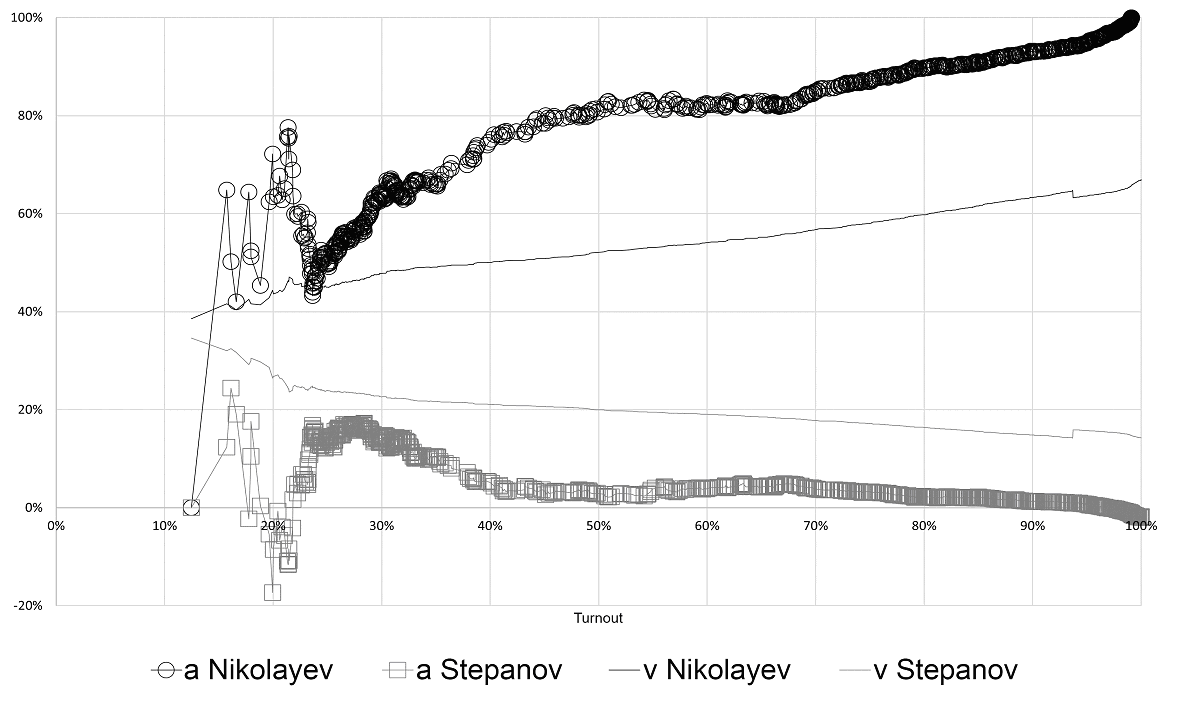
Figure 14. Relationship between v and a indicators and turnout in the Chuvash Republic Head election
As figure 15 illustrates, the vote share for the incumbent exhibits a split pattern: it declines at low turnout levels but rises at higher turnout levels. This pattern most likely reflects an artificial increase in turnout along with a corresponding increase in the incumbent’s support.
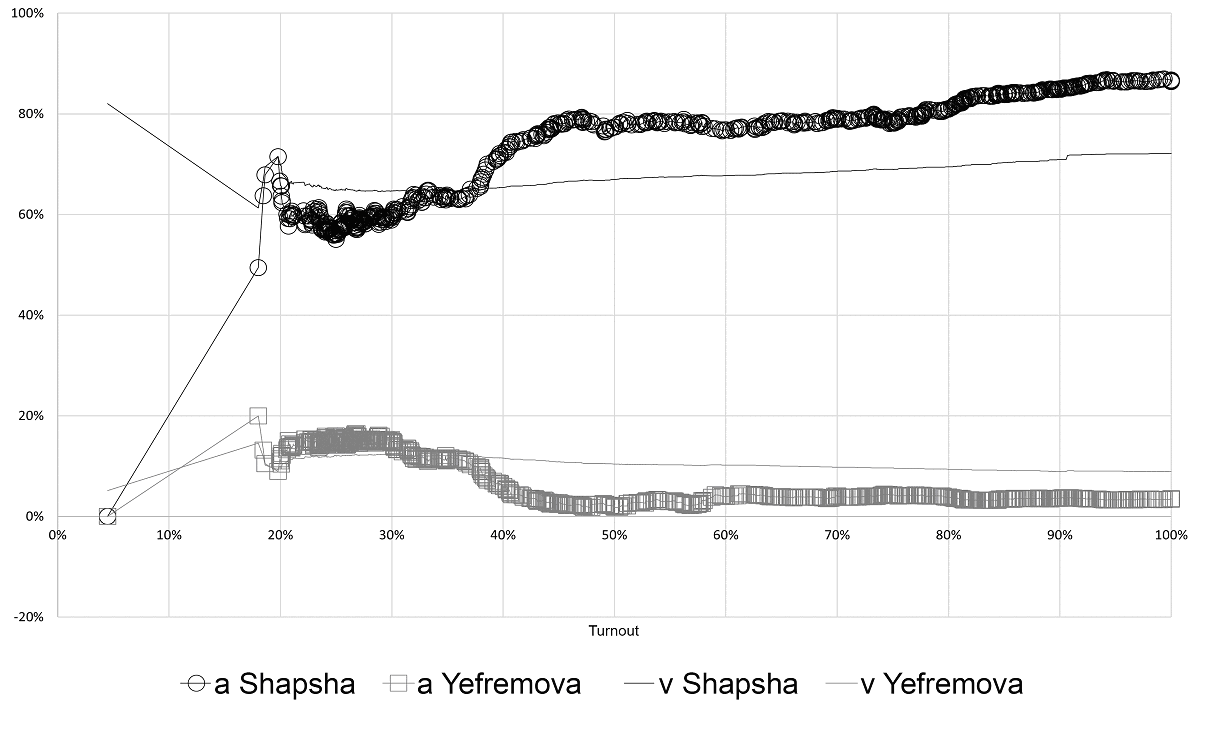
Figure 15. Relationship between v and a indicators and turnout in the gubernatorial election in Kaluga Oblast
As figure 16 illustrates, PECs split into low (20–40%) and high turnout groups, with the incumbent’s vote share falling in the low-turnout group and rising in the high-turnout group. Many commissions recorded 58% turnout with a strong result for the incumbent. REV, on the other hand, corresponded to a drop in the incumbent’s support.
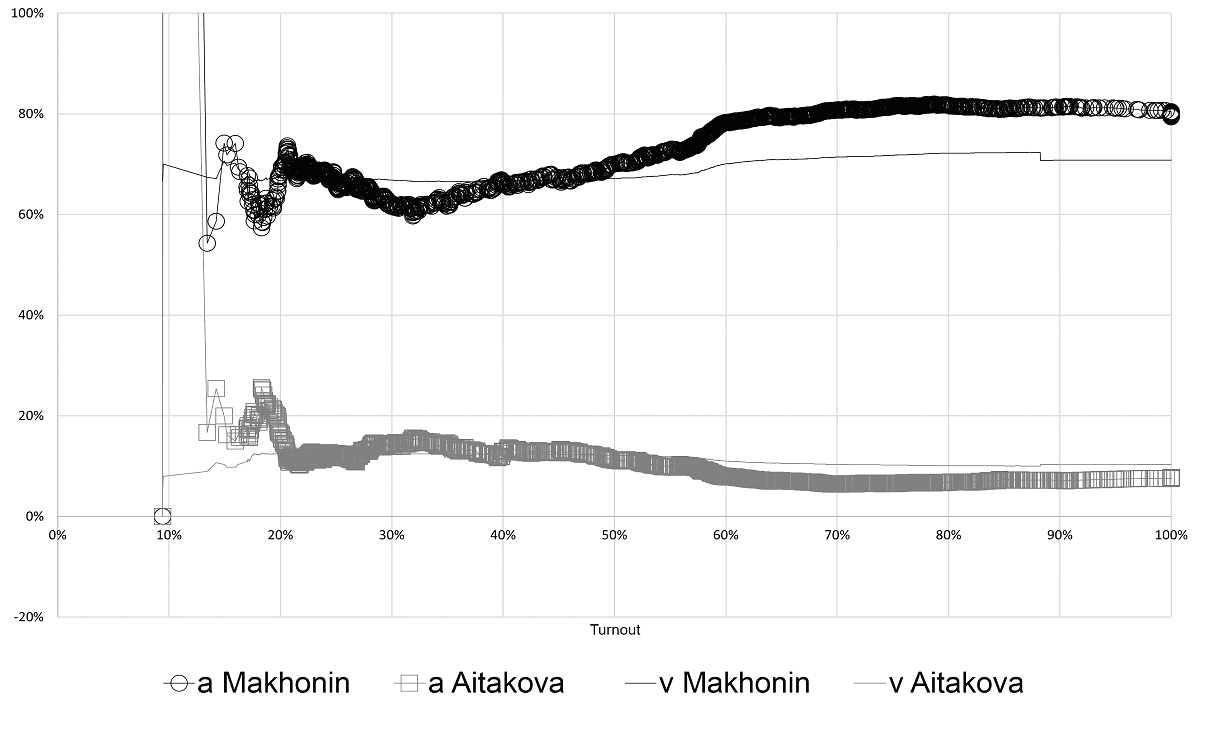
Figure 16. Relationship of v and a indicators and turnout in the gubernatorial election in Perm Krai
Figure 17 shows the typical pattern: the incumbent’s vote share declines at 35–45% turnout but increases at 50–80%. This pattern may indicate possible artificial inflation of both turnout and the challenger’s result.
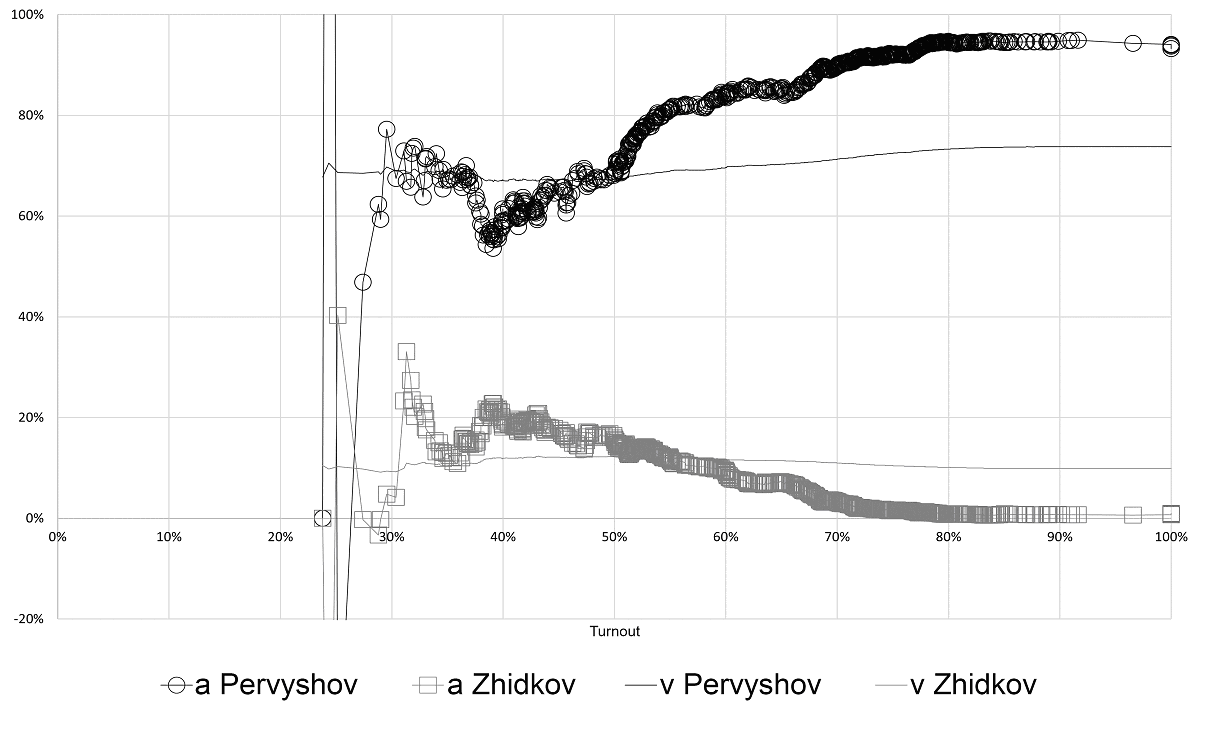
Figure 17. Relationship between v and a indicators and turnout in the gubernatorial election in Tambov Oblast
Figure 18 shows that the incumbent’s vote share rises at 45–55% turnout. PECs with this level constituted the majority. However, many PECs recorded unnaturally high turnout levels.
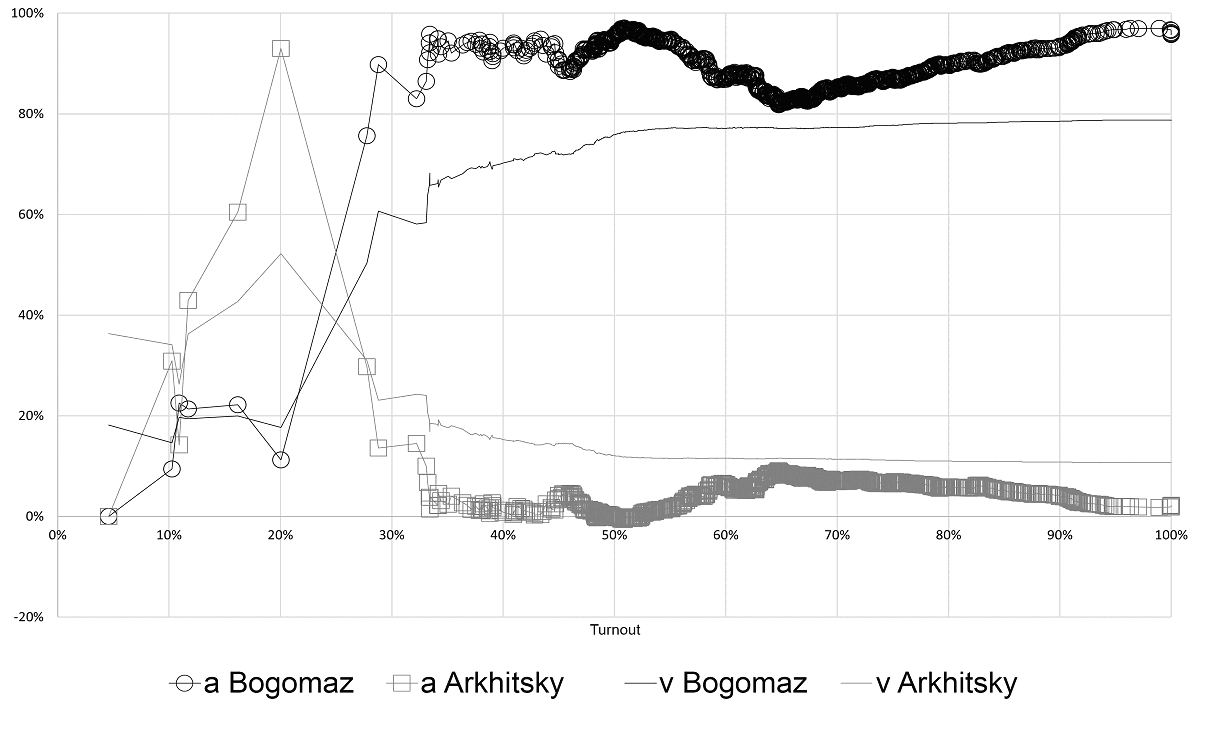
Figure 18. Relationship between v and a indicators and turnout in the gubernatorial election in Bryansk Oblast
In Rostov Oblast, the distribution of electoral rolls by turnout shows an unnatural pattern, with a distinct peak associated with REV (fig. 19). Commissions with about 20% turnout likely reflect genuine participation, while those in the 50–80% range appear artificial. This contributed to a generally uniform increase in the winner’s vote share. There is also a minor spike at 90%, which corresponds to REV.
Figure 19. Relationship between v and a indicators and turnout in the gubernatorial election in Rostov Oblast
In Sevastopol, early voting played a major role, most of it occurring at turnout levels of 55–65% (fig. 20). This explains the spike in the incumbent’s result within this range of turnout. A slight decrease in the incumbent’s result is noticeable at 87% turnout, associated with REV.
Figure 20. Relationship between v and a indicators and turnout in the city of Sevastopol Head election
Due to the small number of voters in the 58–59% turnout range, the spike observed there (fig. 21) may be the result of a fluctuation at one of the precincts. However, at turnout levels of 67% and higher, one may suspect an unnatural increase in the incumbent’s result.
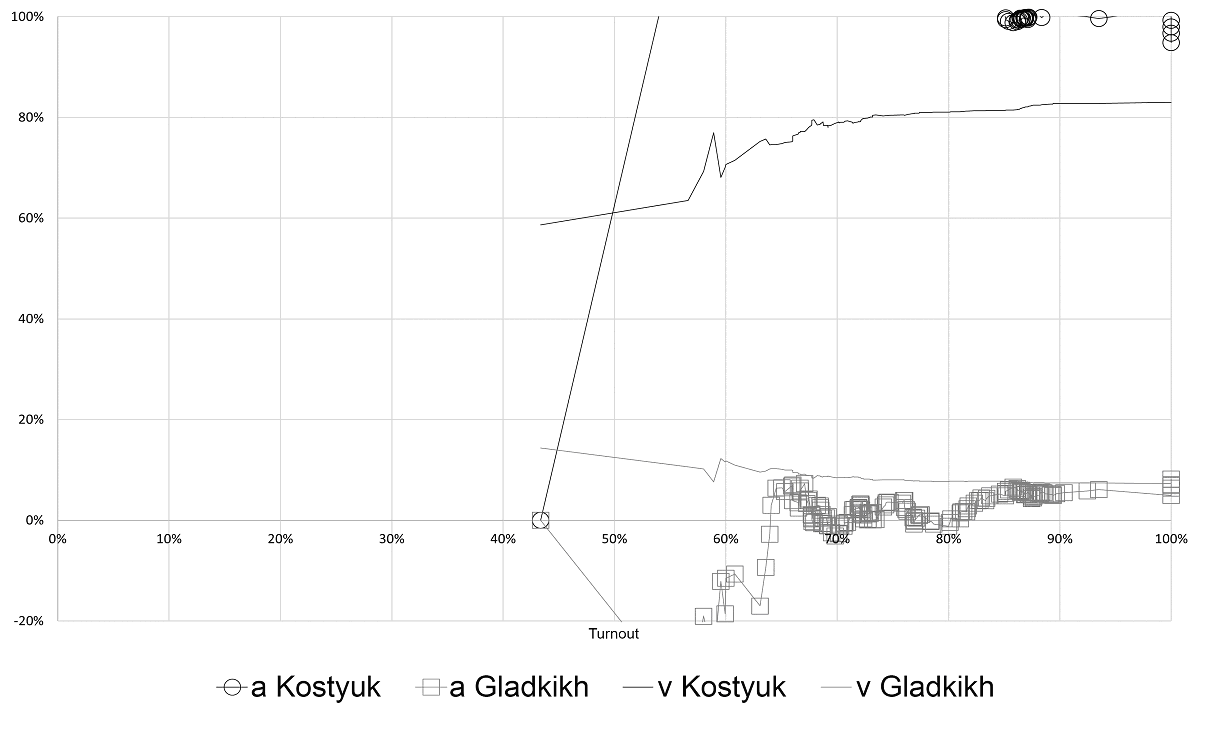
Figure 21. Relationship between v and a indicators and turnout in the gubernatorial election in Jewish Autonomous Oblast
The graph in figure 22 suggests significant distortion of results in the main turnout range, starting at around 30%.
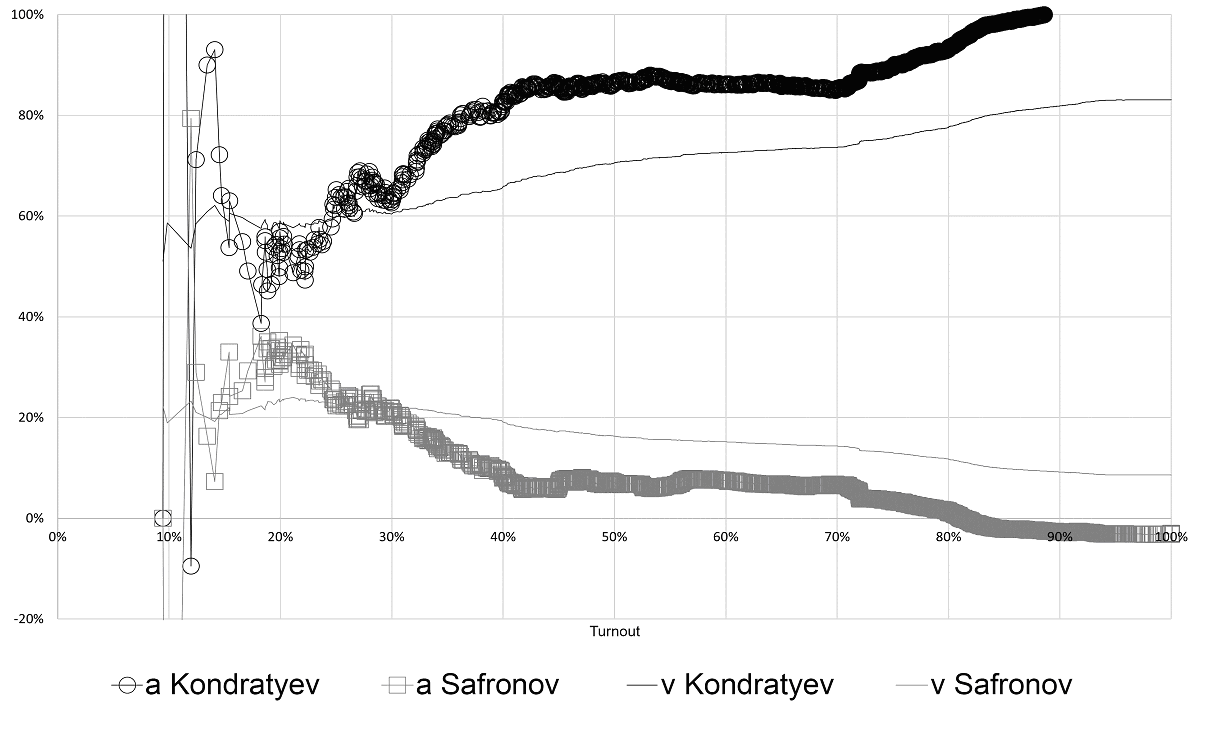
Figure 22. Relationship of v and a indicators and turnout in the gubernatorial election in Krasnodar Krai
In Orenburg Oblast (fig. 23), distortions in the incumbent’s results can also be suspected at turnout levels above 30%.
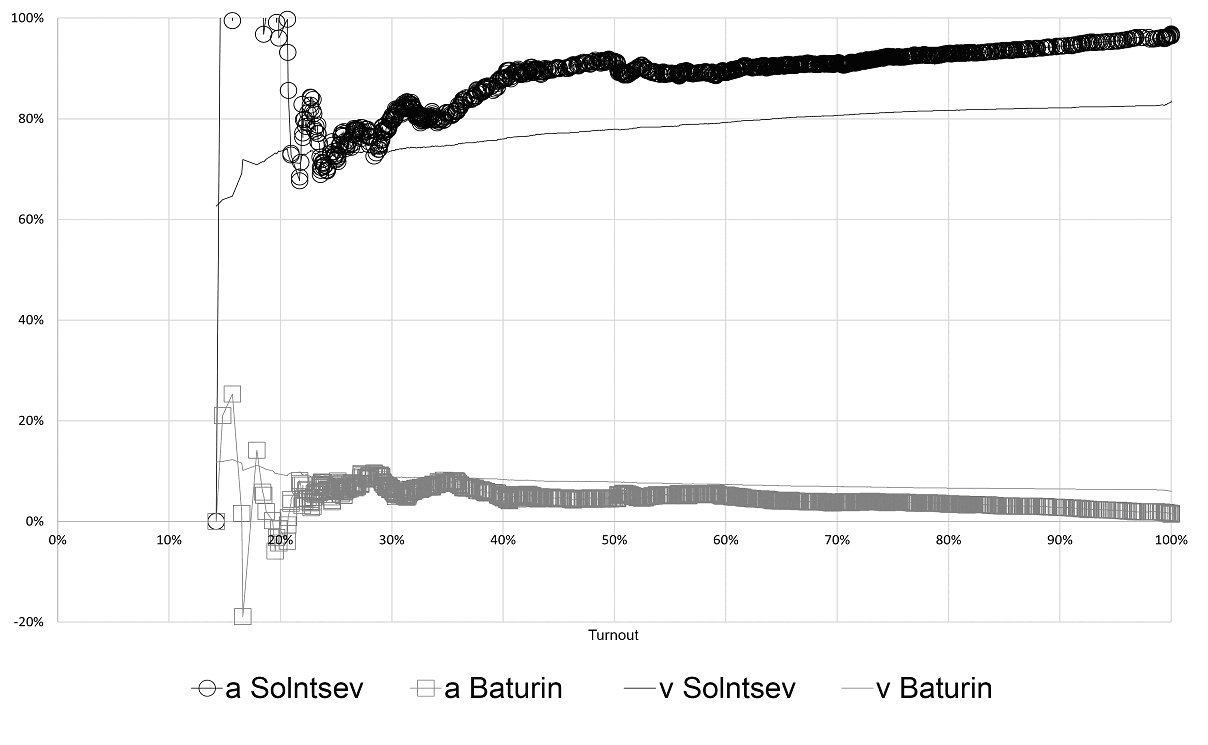
Figure 23. Relationship between v and a indicators and turnout in the gubernatorial election in Orenburg Oblast
Figure 24 shows the 35–45% turnout range, where the incumbent’s result decreased. However, at turnout levels above 50%, an unnatural increase in the incumbent’s result is evident. The spikes at 53% and 70% turnout appear especially unnatural.
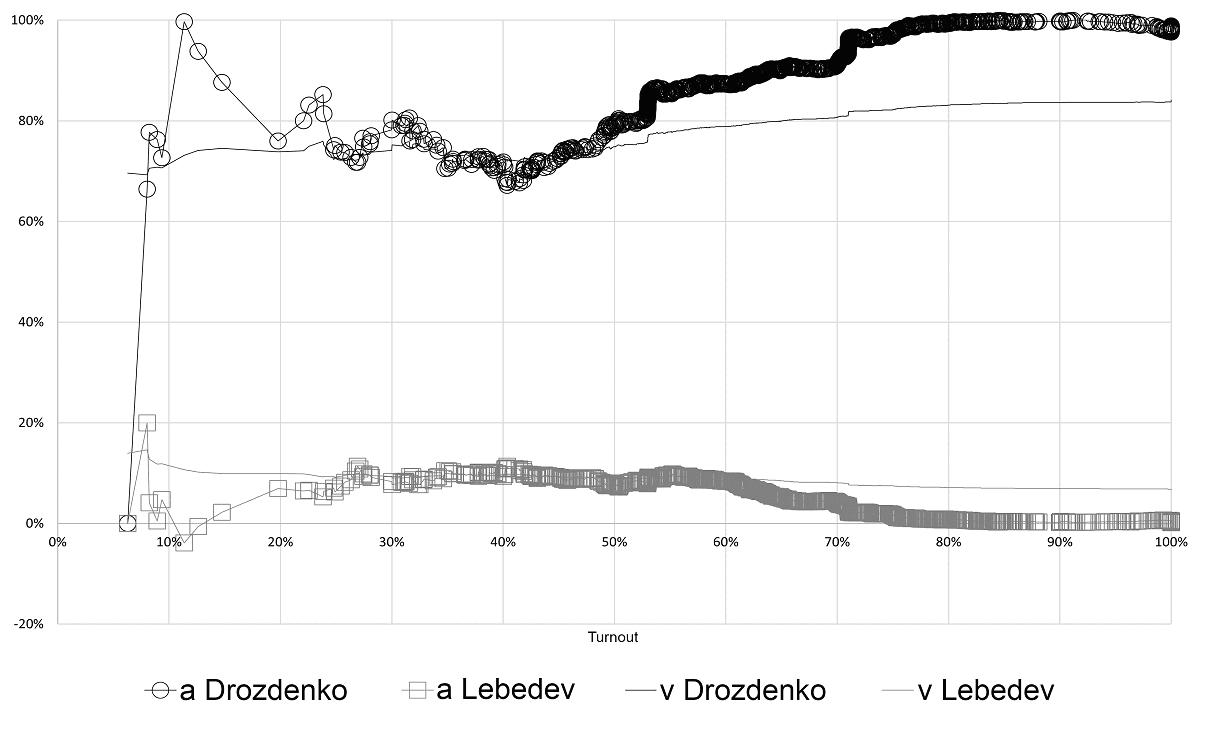
Figure 24. Relationship between v and a indicators and turnout in the gubernatorial election in Leningrad Oblast
The graph in figure 25 displays minor suspicious features, particularly in the 32–42% turnout range and above 60%.
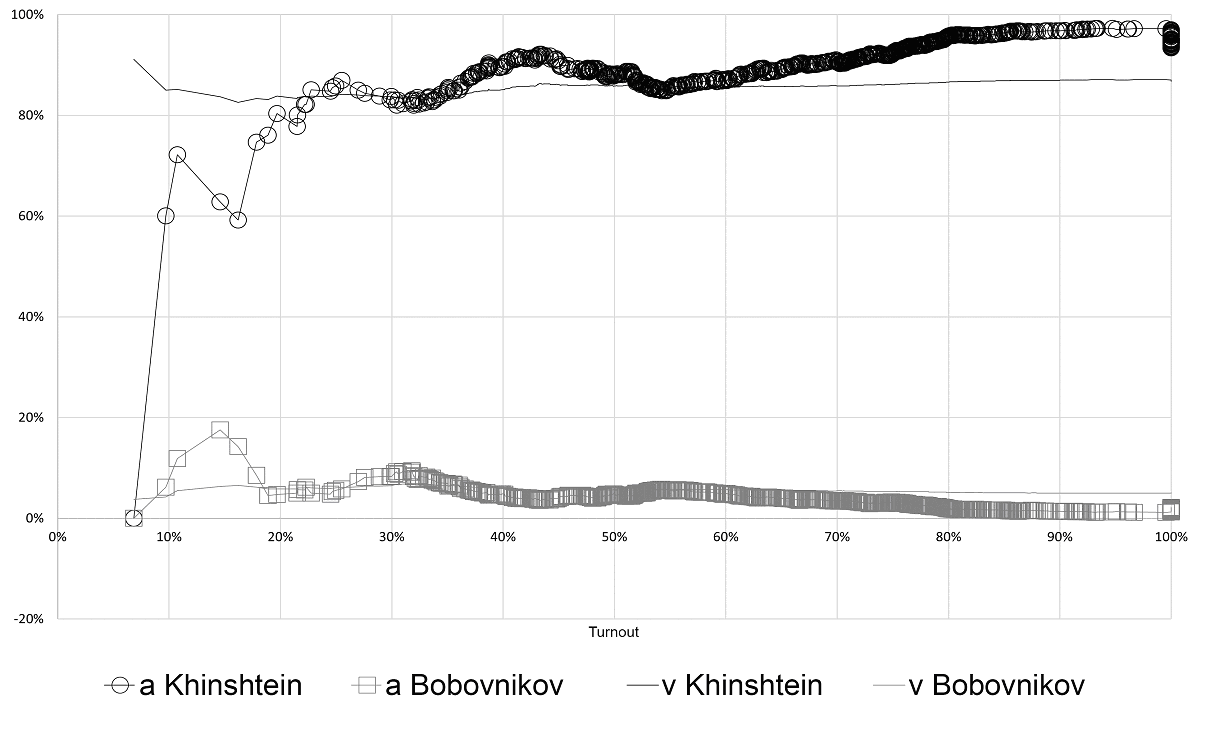
Figure 25. Relationship between v and a indicators and turnout in the gubernatorial election in Kursk Oblast
In Tatarstan (the only region to employ single-day voting) a suspicious concentration of turnout occurs at 55–57%, accompanied by an increase in the incumbent’s result (fig. 26). Additionally, there is an unexpected spike in the number of PECs reporting 87% and 94% turnout, accompanied by a rise in the winner’s result.
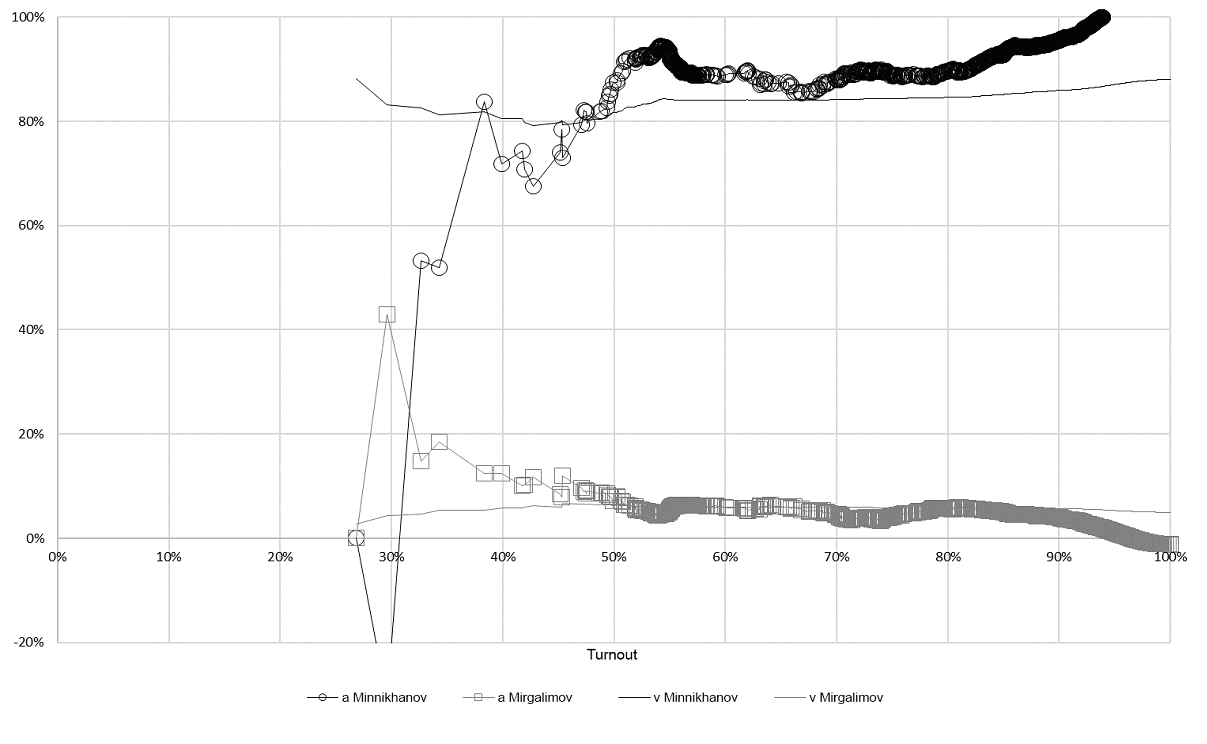
Figure 26. Relationship between v and a indicators and turnout in the Republic of Tatarstan Head election
Below, figure 27 shows the distribution of the number of precinct electoral commissions (more precisely, the number of voters on their electoral rolls) in these elections.
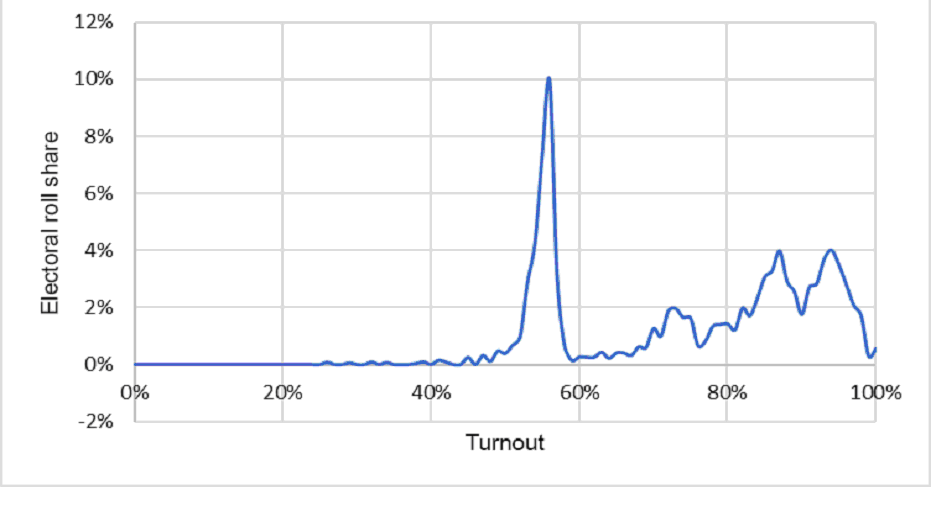
Figure 27. Distribution of electoral rolls by turnout in the election of the Head (Rais) of the Republic of Tatarstan
This strange graph may suggest that the turnout level in Tatarstan was artificial. Combined with the previous graph, one may assume that the incumbent's result was artificially inflated as well.
Received 10.10.2025, revision received 20.10.2025.
References
- Buzin A. Itogi vladivostokskikh sudov [The Results of Court Proceedings in Vladivostok]. – A. Buzin's LiveJournal, 21.02.2019. URL: https://abuzin.livejournal.com/2019/02/21/ (accessed 14.10.2025). (In Russ.) - https://abuzin.livejournal.com/2019/02/21/
- Buzin A.Yu. Evolutsiya elektoralnykh pokazatelei rossiyskikh vyborov v 1996–2012 godakh [The Evolution of Electoral Indicators in Russian Elections, 1996–2012]. – POLIS. Political Studies. 2014. No. 6. P. 62–70. (In Russ.)
- Buzin A.Yu. The Modification of Sobyanin-Soukhovolsky Method. – Electoral Politics. 2019. No. 1. P. 2. - https://electoralpolitics.org/en/articles/modifikatsiia-metoda-sobianina-sukhovolskogo/
- Kynev A.V. Gubernatory v Rossii: mezhdu vyborami i naznacheniyami [Governors in Russia: Between elections and appointments]. Moscow: Liberal Mission Foundation. 2020. 1030 p. (In Russ.)
- Lyubarev A.E. Zanimatelnaya elektoralnaya statistika [Entertaining Election Statistics]. Moscow: Golos Consulting, 2021. 304 p. (In Russ.)
- Shpilkin S. Statisticheskoye issledovaniye rezultatov rossiiskikh vyborov 2007–2009 g. [Statistical Study of Russian Elections 2007–2009. – Troitsky variant – Nauka, 27.10.2009. No. 21(40). P. 2–4. (In Russ.)
- Sobyanin A.A., Sukhovolsky V.G. Demokratiya, ogranichennaya falsifikatsiyami: Vybory i referendumy v Rossii v 1991–1993 gg. [A Democracy curtailed by election fraud: Elections and referenda in Russia in 1991–1993]. Moscow: Proyektnaya gruppa po pravam cheloveka, 1995. 268 p. (In Russ.)